

Sem dados
Pesquisar
Cotações de Ações
As cotações de ações são focadas no mercado dos EUA, incluindo índices, setores e outros ativos de renda variável relacionados.
52378.000+0.21%
7475.100+0.41%
28160.900-0.13%
Distribuição
Últimas
Histórico
Setor
Ver Mais
Serviços Públicos
+858.66%Blink Charging Co+5.51%
Founder Group Ltd+4.07%
WaterBridge Infrastructure LLC+3.95%
Varejo
+8.64%Amazon.com Inc+15.32%
Leslie's Inc+9.56%
Jiuzi Holdings Inc+9.02%
Investimentos Coletivos
+4.11%Oxford Square Capital Corp+7.64%
Apollo Global Management Inc+4.53%
OFS Capital Corp+2.13%
Bens Industriais
+1.23%ARXS.NB+10.86%
CVD Equipment Corp+10.75%
SPX Technologies Inc+10.08%
Energia - Combustíveis Fósseis
+0.89%Recon Technology Ltd+25.95%
Forum Energy Technologies Inc+21.68%
Sable Offshore Corp+18.08%
Produtos de Consumo Cíclicos
+0.72%Kandal M Venture Ltd+141.41%
Purple Innovation Inc+11.42%
K-Tech Solutions Co Ltd+11.27%
Lista de Ações
N.º
Nome
Preço
Variação
Var. %
Pontuação total
Tempo
Volume
Volume
Valor de mercado
Ações
Amplitude
Índice de Volume
Máx. 52 Sem.
Mín. 52 Sem.
Dividendo
Div. Yield
5D
10D
20D
60D
120D
250D
Ano até a data
Minha lista
Análise de Ações
A Semana à Frente: Payroll de julho dos EUA em foco; Resultados de PLTR, SanDisk, AMD e SpaceX à frente
TradingKey - Na próxima semana, os mercados globais estarão atentos aos dados de emprego dos EUA, às leituras do Índice de Gerentes de Compras (PMI) e a uma nova rodada intensa de balanços corporativos norte-americanos. Os EUA divulgarão o relatório de folha de pagamento não agrícola (payroll) de julho, os dados de emprego da ADP e os índices ISM de Manufatura e Serviços. Os investidores utilizarão esses indicadores para avaliar se a economia dos EUA permanece resiliente e se o Federal Reserve precisará apertar ainda mais a política monetária em sua reunião de setembro.
TradingKeyhá 9 horas

Previsão do Preço das Ações da Microsoft: Demanda por IA Está se Transformando em Receita Real de Nuvem, Ações Podem Voltar a $500
As ações da Microsoft (MSFT) subiram acima da marca de US$ 460 após a divulgação de seu relatório de resultados do 4º trimestre do ano fiscal de 2026, deixando o papel a apenas US$ 1 de sua máxima anterior de US$ 466,32. Os resultados destacaram que o principal catalisador para a força das ações é a evidência de que a monetização de IA entrou em uma trajetória acelerada, refletindo ainda o foco intensificado dos investidores no retorno sobre o investimento (ROI) dos gastos com IA.
TradingKeyhá 21 horas

Valor de mercado da Apple supera US$ 5 trilhões após rali de 25%: Estratégia de IA pode sustentar novos ganhos?
TradingKey - Na terça-feira (28 de julho), horário do Leste, o preço das ações da Apple atingiu uma máxima intradiária de US$ 342,89, elevando a capitalização de mercado da empresa para aproximadamente US$ 5,04 trilhões em determinado momento. A Apple tornou-se, assim, a segunda empresa de capital aberto no mundo a superar a marca de US$ 5 trilhões em valor de mercado, seguindo a Nvidia (NVDA). Apenas um dia antes, o valor de mercado da Apple havia ultrapassado o da Nvidia, recuperando seu status como a empresa mais valiosa do mundo.
TradingKeysáb, 1 de ago
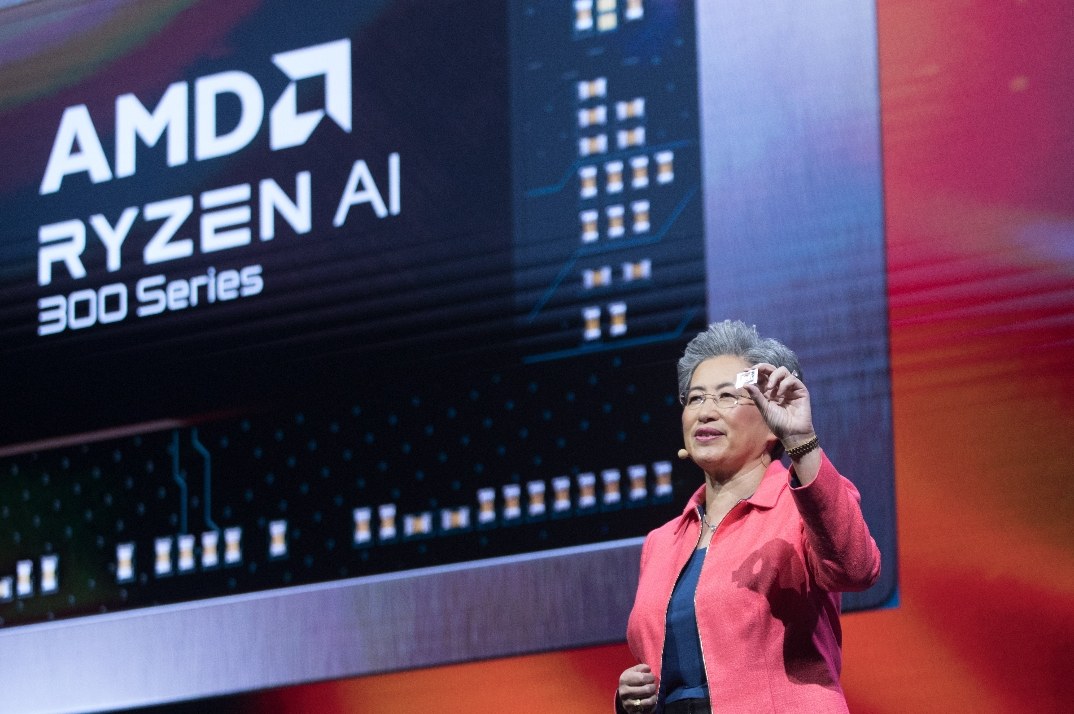
AMD cai quase 20% em relação às máximas antes do balanço; o valor de mercado de US$ 1 trilhão ainda pode ser alcançado?
TradingKey - Em 31 de julho, horário do leste, a AMD (AMD) fechou a US$ 476,15, representando uma capitalização de mercado de aproximadamente US$ 776,41 bilhões, com queda de 1,90% no dia. Após uma rodada anterior de forte volatilidade, o preço da ação registrou uma retração cumulativa de quase 18,5% em relação à sua máxima histórica de US$ 584.
TradingKeysáb, 1 de ago
Previsão do Preço das Ações da Apple: O AAPL Pode Ultrapassar US$ 400 até 2026? Análise do Preço-Alvo Mais Alto de Wall Street
A Apple apresentou o desempenho mais forte entre as "Sete Magníficas", impulsionada por lucros recordes, recompras robustas de ações e uma estratégia de IA com baixo Capex, enquanto o preço de suas ações ultrapassou US$ 340 e sua capitalização de mercado atingiu US$ 5 trilhões. Apesar da pressão de curto prazo decorrente de condições de sobrecompra e correções técnicas, as instituições de Wall Street permanecem amplamente otimistas quanto aos seus fundamentos, com os preços-alvo mais elevados atingindo US$ 400.
TradingKeysáb, 1 de ago
Nvidia Acusada de ‘Financiamento Circular’ em Acordo de US$ 750 Bilhões com SK Group e OpenAI: Por que o Mercado Está em Pânico
TradingKey - De acordo com relatos da imprensa, a Nvidia (NVDA) está avançando em uma nova rodada de acordos de infraestrutura de IA que podem totalizar mais de US$ 750 bilhões, incluindo um acerto superior a US$ 500 bilhões com o grupo sul-coreano SK Group e negociações com a OpenAI para até US$ 250 bilhões em garantias de leasing. No entanto, o mercado demonstra preocupação de que tais modelos de "financiamento circular" possam estar distorcendo a demanda real dentro da indústria de IA.
TradingKeysáb, 1 de ago
TradingKey SmartPicks

Estratégia Quantitativa de Crescimento e Valor de Colin McLean Aprimorada pela TK
Combinando fundamentos e comportamento de mercado por meio de algoritmos inteligentes, esta abordagem utiliza sinais dinâmicos e multifrequenciais para ampliar o alfa do investimento em valor nos mercados modernos.
Variação


Estratégia de Riqueza Prudente de Howard Rothman
Um método quantitativo inteligente que se adapta dinamicamente a mercados de alta e baixa — oferecendo a combinação perfeita de crescimento estável e controle preciso de risco.
Variação


Estratégia de Crescimento Racional de David Polen
Essa estratégia dá continuidade à filosofia de investimento de David Polen, focada na manutenção de empresas com fluxos de caixa de alta qualidade, incorporando o modelo de avaliação por taxa de retorno implícita. O objetivo é buscar um crescimento equilibrado em relação ao preço de entrada, por meio de métodos quantitativos, evitando a busca cega por ativos caros e garantindo que cada posição possua um retorno esperado razoável.
Variação


Estratégia de Crescimento com Baixo Risco de Michael J. Carr
Essa estratégia é baseada no conceito de “investimento lucrativo” proposto por Michael J. Carr. Seu princípio central não é prever as altas e quedas do mercado, mas identificar o estado atual de risco do mercado e, a partir disso, decidir se e como assumir riscos.
Variação


Próximos eventos
Declarações
Dividendo
Desdobramento de ações
IPO
2026-08-03
Pré-mercado
Marriott International Inc
MAR
Previsão por Ação3.09
LPA Atual--
Previsão de receita7.20B
Receita atual--
2026-08-03
Pré-mercado
Tyson Foods Inc
TSN
Previsão por Ação0.99
LPA Atual--
Previsão de receita14.12B
Receita atual--
2026-08-03
Pré-mercado
Avista Corp
AVA
Previsão por Ação0.24
LPA Atual--
Previsão de receita419.21M
Receita atual--
2026-08-03
Pré-mercado
Kosmos Energy Ltd
KOS
Previsão por Ação0.09
LPA Atual--
Previsão de receita483.05M
Receita atual--
Termômetro do mercado
Ações
Setor