18.196
Today
-0.49%
5 Days
+2.71%
1 Month
+7.08%
6 Months
+2.14%
Year to Date
+1.06%
1 Year
-0.62%
Opening Price
18.289Previous Closing Price
18.286
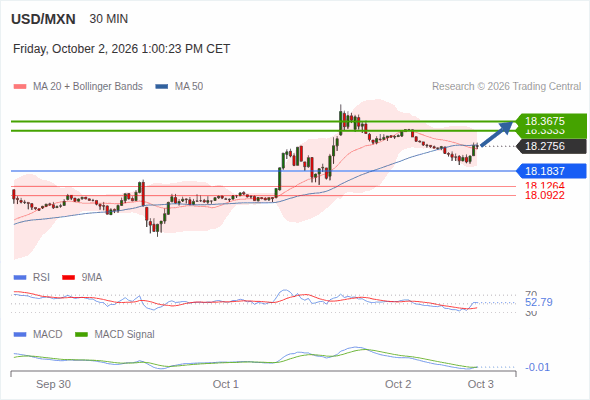
The upside prevails as long as 18.1837 is support, with 18.3333 and 18.3675 as targets
below 18.1837, expect 18.1264 and 18.0922.
The upside prevails as long as 18.1837 is support, with 18.3333 and 18.3675 as targets
• USDMXN declined due to Latin American asset demand and dollar consolidation. • Banxico maintained its rate at 6.50% to anchor local yields. • Technical indicators show the currency pair is currently in overbought conditions.
MUFG’s Derek Halpenny notes that rising rates volatility is driving a broader unwind of EM FX carry trades, with LatAm currencies under particular pressure. USD/MXN has surged and MXN long leveraged positions are being squeezed as implied volatility jumps.
A Bank of Mexico (Banxico) survey of private economists surveyed between September 15-28, revised down their headline and core inflation forecasts, updated their projections for the USD/MXN exchange rate, and revised their projections for the future of interest rates set by the Mexican institution.
The Mexican Peso collapses, extending its depreciation by over 1.50% in the day as the Greenback strengthens sharply amid growing fears that the Middle East conflict will be prolonged, keeping energy prices under pressure. The USD/MXN trades at 18.35, after bouncing off daily lows of 18.06.
Commerzbank’s research notes that the Mexican Peso (MXN) had a disappointing September, losing over 4% against the Dollar since late month.
• USDMXN rose due to narrowed U.S.-Mexico interest rate differentials and carry trade unwinding. • Institutional investors liquidated long peso positions, driving capital outflows from local debt instruments. • Technical indicators show a MACD buy signal alongside overbought RSI and Williams %R readings.
The Indicators feature provides value and direction analysis for various instruments under a selection of technical indicators, together with a technical summary.
This feature includes nine of the commonly used technical indicators: MACD, RSI, KDJ, StochRSI, ATR, CCI, WR, TRIX and MA. You may also adjust the timeframe depending on your needs.
Please note that technical analysis is only part of investment reference, and there is no absolute standard for using numerical values to assess direction. The results are for reference only, and we are not responsible for the accuracy of the indicator calculations and summaries.