Indicators
Indicators
Value
Direction
MACD(12,26,9)
-0.001
Sell
RSI(14)
30.396
Neutral
STOCH(KDJ)(9,3,3)
20.361
Neutral
ATR(14)
0.004
Low Volatility
CCI(14)
-125.807
Sell
Williams %R
91.279
Oversold
TRIX(12,20)
-0.083
Sell
StochRSI(14)
27.324
Sell


Today
-0.25%
5 Days
-0.75%
1 Month
-1.87%
6 Months
-0.11%
Year to Date
-1.79%
1 Year
-1.78%
Opening Price
0.917Previous Closing Price
0.917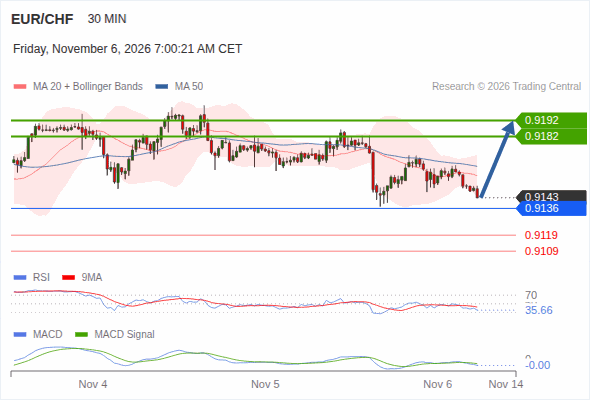
Rebound above 0.9136 towards 0.9192
below 0.9136, expect 0.9119 and 0.9109.
Rebound above 0.9136 towards 0.9192
EUR/CHF remains flat after recovering daily losses, trading around 0.9170 during European hours on Thursday. The currency cross may see upward momentum as the Euro (EUR) gains support from falling crude oil prices.
Chris Turner at ING notes EUR/CHF fell after Swiss inflation surprised at 1.5% year-on-year, raising doubts that the Swiss National Bank can avoid tightening through 2027. He recalls the SNB’s 2023 strategy of driving the Swiss Franc stronger via FX sales and expects growing interest in the currency, with downside risks to existing EUR/CHF forecasts over coming months.
Societe Generale strategists note EUR/CHF has broken a short-term uptrend and failed to hold its 200-day moving average, reinforcing downside momentum. The cross is drifting toward the May low near 0.9095, identified as potential support.
Societe Generale’s technical team notes EUR/CHF has broken a multi-month ascending trend line and briefly slipped below its 200-day moving average, forming an interim low near 0.9195. They see a rebound developing but stress the importance of reclaiming 0.9335/0.9370.
Societe Generale’s Kit Juckes highlights the Swiss Franc’s role as a funding currency, with gradual depreciation interrupted by sharp rebounds during periods of market stress. With Swiss inflation subdued and fiscal and external balances stable, he sees little pressure on the SNB to raise rates.
Francesco Pesole at ING highlights renewed pressure on French bonds, with the 10-year OAT-Bund spread nearing early October highs as budget worries and social unrest weigh on sentiment.
The Indicators feature provides value and direction analysis for various instruments under a selection of technical indicators, together with a technical summary.
This feature includes nine of the commonly used technical indicators: MACD, RSI, KDJ, StochRSI, ATR, CCI, WR, TRIX and MA. You may also adjust the timeframe depending on your needs.
Please note that technical analysis is only part of investment reference, and there is no absolute standard for using numerical values to assess direction. The results are for reference only, and we are not responsible for the accuracy of the indicator calculations and summaries.