USD/JPY
USDJPY155.064USD
Today
-0.01%
5 Days
+1.59%
1 Month
-1.94%
6 Months
+5.25%
Year to Date
-1.05%
1 Year
+3.63%
Key Data Points
Opening Price
155.080Previous Closing Price
155.081Indicators
The Indicators feature provides value and direction analysis for various instruments under a selection of technical indicators, together with a technical summary.
This feature includes nine of the commonly used technical indicators: MACD, RSI, KDJ, StochRSI, ATR, CCI, WR, TRIX and MA. You may also adjust the timeframe depending on your needs.
Please note that technical analysis is only part of investment reference, and there is no absolute standard for using numerical values to assess direction. The results are for reference only, and we are not responsible for the accuracy of the indicator calculations and summaries.
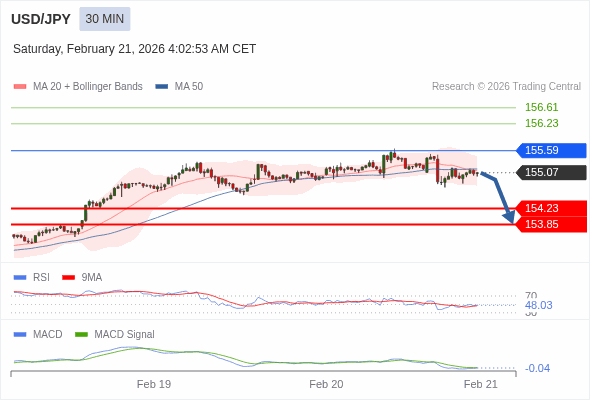
USD/JPY Trading Strategy

Trading Strategy
The configuration is negative.
Alternative scenario
above 155.59, look for 156.23 and 156.61.
Comment
the downside prevails as long as 155.59 is resistance
USD/JPY News
Beyond Gold, What Is the Next Safe-Haven Asset Choice?
TradingKey - Against the backdrop of heightened global market volatility, escalating geopolitical risks, and mixed macroeconomic signals, market safe-haven sentiment continues to intensify. In the face of rising uncertainty, an increasing number of investors are seeking safe havens capable of wealth preservation and risk mitigation.

USD/JPY falls as Japanese inflation moderates, US fiscal uncertainty weighs
USD/JPY is trading around 154.90 on Friday at the time of writing, down 0.13% on the day.

USD/JPY: Geopolitics support Dollar gains – MUFG
MUFG’s Head of Research Derek Halpenny notes the US Dollar has extended gains as markets focus on potential US military action against Iran.

USD/JPY: Policy focus tempers safe haven appeal – DBS
DBS's Chang Wei Liang note USD/JPY has moved above 155 on broad Dollar strength, even as geopolitical risks could support the Japanese Yen as a safe haven. Japan’s FY26 budget debate and Prime Minister Takaichi’s proposal to suspend the consumption tax on food are seen as key for JPY direction.

Japan: Solid services inflation backs BoJ stance – Societe Generale
Societe Generale economists Reo Sakida and Jin Kenzaki review latest Japan inflation data, noting Headline at 1.5%, Core at 2.0% and Core-core at 2.6%.

USD/JPY: Policy focus tempers safe haven appeal – DBS
DBS's Chang Wei Liang note USD/JPY has moved above 155 on broad Dollar strength, even as geopolitical risks could support the Japanese Yen as a safe haven. Japan’s FY26 budget debate and Prime Minister Takaichi’s proposal to suspend the consumption tax on food are seen as key for JPY direction.


