Indicators
Indicators
Value
Direction
MACD(12,26,9)
-0.003
Neutral
RSI(14)
51.939
Neutral
STOCH(KDJ)(9,3,3)
28.669
Buy
ATR(14)
0.005
High Vlolatility
CCI(14)
-38.270
Neutral
Williams %R
61.546
Sell
TRIX(12,20)
0.015
Sell
StochRSI(14)
100.000
Buy


0.827
Today
-0.02%
5 Days
+0.40%
1 Month
-0.23%
6 Months
+5.39%
Year to Date
+4.34%
1 Year
+3.99%
Opening Price
0.826Previous Closing Price
0.827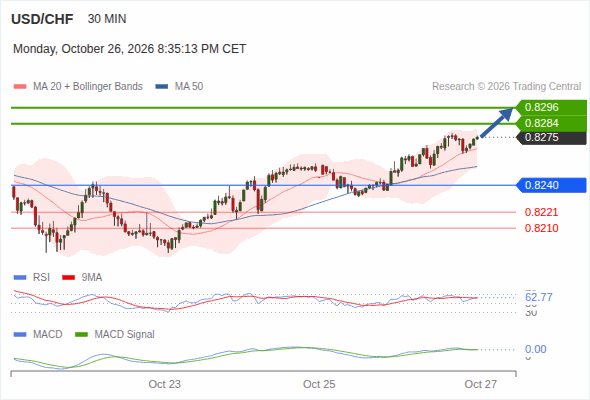
The upside prevails as long as 0.8240 is support, with 0.8284 and 0.8296 as targets
below 0.8240, expect 0.8221 and 0.8210.
The upside prevails as long as 0.8240 is support, with 0.8284 and 0.8296 as targets
United Overseas Bank analysts Quek Ser Leang and Lee Sue Ann note that USD/CHF has shifted from a prior negative bias into a range-trading phase. They see the Dollar’s rapid rebound losing momentum below key resistance, with intraday support levels defining near-term risks.
The US Dollar (USD) holds Friday’s gains against the Swiss Franc (CHF) on Monday, with the USD/CHF pair standing comfortably at the 0.7250 area, and the two-week high at 0.7270 at a short distance.
USD/CHF depreciates after registering over 0.5% gains the previous day, trading around 0.8230 during Asian hours on Monday.
USD/CHF rebounds on Friday, reversing the previous day’s losses as the US Dollar (USD) regains some ground alongside US Treasury yields. At the time of writing, the pair trades around 0.8250, up 0.56% on the day, after falling to a one-month low of 0.8191 on Thursday.
• USDCHF advanced due to a broader US Dollar recovery and widening rate differentials. • The Swiss National Bank maintained a zero percent policy rate amid subdued inflation. • Technical indicators show a neutral MACD, a neutral RSI, and a sell Williams %R.
The US Dollar (USD) is trimming losses against the Swiss Franc (CHF) on Friday, as the risk-off mood, stemming from surging Oil prices, has offset the negative impact of falling US Treasury yields.
The Indicators feature provides value and direction analysis for various instruments under a selection of technical indicators, together with a technical summary.
This feature includes nine of the commonly used technical indicators: MACD, RSI, KDJ, StochRSI, ATR, CCI, WR, TRIX and MA. You may also adjust the timeframe depending on your needs.
Please note that technical analysis is only part of investment reference, and there is no absolute standard for using numerical values to assess direction. The results are for reference only, and we are not responsible for the accuracy of the indicator calculations and summaries.