

Indicators
Indicators
Value
Direction
MACD(12,26,9)
2.002
Neutral
RSI(14)
52.925
Neutral
STOCH(KDJ)(9,3,3)
68.541
Neutral
ATR(14)
7.346
High Vlolatility
CCI(14)
59.698
Neutral
Williams %R
24.215
Buy
TRIX(12,20)
0.051
Sell
StochRSI(14)
59.198
Sell


Today
-1.55%
5 Days
+0.66%
1 Month
+4.36%
6 Months
+11.24%
Year to Date
+11.94%
1 Year
+22.24%
NVIDIA Corp's fundamentals are relatively healthy, and its growth potential is high.Its valuation is considered fairly valued, ranking 43 out of 105 in the Semiconductors & Semiconductor Equipment industry.Institutional ownership is very high.Over the past month, multiple analysts have rated it as Buy, with the highest price target at 297.15.In the medium term, the stock price is expected to remain stable.Despite a good stock market performance and outperforming fundamentals over the past month, the technicals don't support the current trend.The stock price is trading sideways between the support and resistance levels, making it suitable for range-bound swing trading.

Media Coverage

NVIDIA Corporation, an American multinational technology firm, is headquartered in Santa Clara, California, and incorporated in Delaware. Established in 1993 by Jensen Huang, Chris Malachowsky, and Curtis Priem, the company designs graphics processing units, data science APIs for high-performance computing, and system on a chip units for automotive and mobile markets. As a premier supplier of artificial intelligence solutions, NVIDIA designs hardware that is manufactured through outsourcing partnerships.
The company's professional GPU series powers edge-to-cloud computing systems, supercomputers, and workstations across architecture, engineering, media, automotive, scientific research, and manufacturing sectors. Its GeForce GPU line serves consumer applications including PC gaming, 3D rendering, and video production, commanding 65% of global discrete desktop GPU sales in Q4 2024. NVIDIA's gaming ecosystem includes Shield Portable handhelds, Shield Tablets, Shield TV media players, and the GeForce Now cloud gaming platform.
Beyond hardware, NVIDIA develops the CUDA parallel computing platform enabling GPU-accelerated programs deployed in global supercomputing facilities. Since the late 2000s, its Tegra processors have powered mobile devices and automotive infotainment systems. Key competitors span AMD, Intel, Qualcomm, and AI specialists like Cerebras and Graphcore, while its Maxine software suite delivers AI-enhanced audio/video processing.
TradingKey - On July 23 ET, Nvidia (NVDA) and semiconductor packaging and testing provider Amkor Technology (AMKR) signed a multi-year packaging services agreement valued at approximately $1.5 billion. Boosted by this news, Amkor's stock price rose more than 12% in after-hours trading on Thursday.
TradingKey - On Thursday Eastern Time, the three major U.S. stock index futures fell collectively in pre-market trading. Negative reactions following the earnings reports of Alphabet (GOOGL) and Tesla (TSLA) reignited market concerns regarding artificial intelligence capital expenditures and returns on investment; meanwhile, the escalation of the conflict between the U.S. and Iran pushed international oil prices sharply higher, as energy inflation and the risk of Federal Reserve rate hikes returned to the market focus.

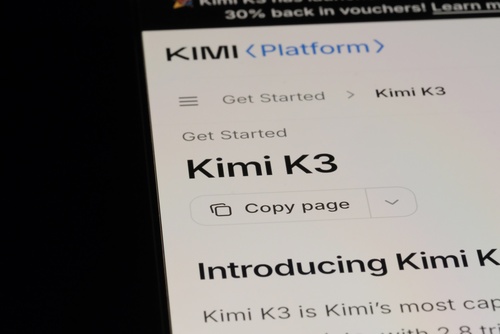
Tradingkey - Michael Kratsios, Director of the White House Office of Science and Technology Policy (OSTP), called out Chinese AI company Moonshot AI on the social media platform X, accusing it of acquiring servers equipped with NVIDIA GB300 (Blackwell series) chips through Thailand to train its Kimi K3 model and building a "complex internal platform" for large-scale distillation of U.S. models. This marks the second time in just two days that the Trump administration has issued a warning regarding "intellectual property theft" by Chinese AI models. Following Treasury Secretary Scott Bessent's threat of sanctions against Kimi just a day earlier, these latest allegations, which include specific chip models, represent a significant escalation in signaling.
Tradingkey - Nvidia (NVDA) has released the full specifications and benchmark data for its first self-developed data center CPU, Vera, marking its official entry into the server CPU market dominated by Intel and AMD. Company representatives confirmed that Vera chips were delivered to customers including OpenAI, Anthropic, and SpaceX in June, and OpenAI plans to begin large-scale deployment starting this quarter. Following the announcement, Nvidia's stock price pulled back slightly as the market reacted tepidly to the news. As of press time, the stock was up 1.06% at $205.43.

TradingKey - On Monday, July 20, Eastern Time, Nvidia (NVDA) filed a Schedule 13G with the U.S. Securities and Exchange Commission, disclosing that it holds approximately 9.3% of the Class A ordinary shares of AI cloud service provider Nebius Group (NBIS), totaling 22,256,412 shares. Following the announcement, Nebius's pre-market share price rose by more than 7% on Tuesday. As of press time, Nebius was trading at approximately $194.45, up 6.48%.

TradingKey - Microsoft (MSFT) announced that it will deploy AMD's next-generation rack-scale AI system, Helios, in its Azure data centers to provide computing power support for frontier large model inference and Azure AI services. This move not only signifies a further expansion of Microsoft's partnership with AMD but also adds another top-tier global cloud service provider to the list of Helios customers, following Meta (META), OpenAI, and Oracle (ORCL).
NVIDIA Corporation, an American multinational technology firm, is headquartered in Santa Clara, California, and incorporated in Delaware. Established in 1993 by Jensen Huang, Chris Malachowsky, and Curtis Priem, the company designs graphics processing units, data science APIs for high-performance computing, and system on a chip units for automotive and mobile markets. As a premier supplier of artificial intelligence solutions, NVIDIA designs hardware that is manufactured through outsourcing partnerships.
The company's professional GPU series powers edge-to-cloud computing systems, supercomputers, and workstations across architecture, engineering, media, automotive, scientific research, and manufacturing sectors. Its GeForce GPU line serves consumer applications including PC gaming, 3D rendering, and video production, commanding 65% of global discrete desktop GPU sales in Q4 2024. NVIDIA's gaming ecosystem includes Shield Portable handhelds, Shield Tablets, Shield TV media players, and the GeForce Now cloud gaming platform.
Beyond hardware, NVIDIA develops the CUDA parallel computing platform enabling GPU-accelerated programs deployed in global supercomputing facilities. Since the late 2000s, its Tegra processors have powered mobile devices and automotive infotainment systems. Key competitors span AMD, Intel, Qualcomm, and AI specialists like Cerebras and Graphcore, while its Maxine software suite delivers AI-enhanced audio/video processing.
Related Instruments



















Popular Instruments







