

WTI
85.934
Today
+3.32%
5 Days
-4.56%
1 Month
+26.43%
6 Months
+31.21%
Year to Date
+49.96%
1 Year
+29.15%
Key Data Points
Opening Price
83.094Previous Closing Price
83.170WTI Technical Analysis
Technical Indicators
Summary
Moving Average
WTI Trading Strategy
Trading Strategy
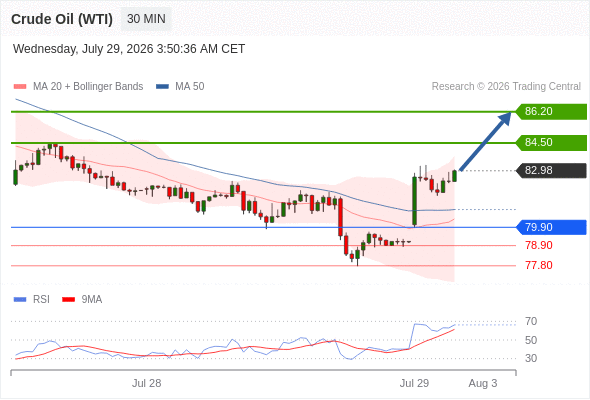
Long positions above 79.90 with targets at 84.50 & 86.20 in extension.
Alternative scenario
below 79.90 look for further downside with 78.90 & 77.80 as targets.
Comment
long positions above 79.90 with targets at 84.50 & 86.20 in extension.
WTI News
US and Israel plan to attack Iran's energy infrastructure – CBS News
CBS News reported that the United States and Israel may engage in a large campaign against Iran, targeting Iran's energy infrastructure, said multiple sources.

WTI Oil recovers above $83 ahead of OPEC meeting
West Texas Intermediate (WTI) US Oil trades higher on Friday, rising 0.76% to around $83.30 after staging a sharp rebound from an intraday low below $80.00.

WTI Oil drifts closer to $80.00 amid a mild increase in traffic through Hormuz
Oil prices are ticking lower for the second consecutive day on Friday, with the US benchmark West Texas Intermediate (WTI) barrel hitting session lows a few cents above $80.00.

WTI falls to near $80.50 on profit-taking, increased traffic through Strait of Hormuz
West Texas Intermediate (WTI), the US crude oil benchmark, is trading around $80.50 during the early European trading hours on Friday. WTI tumbles as traders book some profits despite ongoing conflicts in the Middle East.

WTI (USOIL) Volatility Intensified on Jul 31: What to Watch
• WTI crude declined due to weakening manufacturing data from China. • Anticipated OPEC+ supply increases created bearish sentiment regarding global market imbalances. • A stronger US dollar and technical selling pressure accelerated the price decline.

WTI holds losses around $82.50 on renewed US-Iran diplomatic hopes
West Texas Intermediate (WTI) oil price remains in the negative territory for the second successive day, trading around $82.60 per barrel during the Asian hours on Friday. Crude oil prices have lost ground following renewed hopes for a diplomatic solution to the US-Iran conflict.

More Details of WTI
What is US OIl?
What's the current price of US Oil?
The opening price of US Oil (WTI) on March 5, 2026 was $76.82/bbl.
What is WTI all time high?
How does the price of USOIL fluctuate?
The price of USOIL can fluctuate due to several factors, including global supply and demand, OPEC production levels, geopolitical tensions, economic growth, currency fluctuations, and changes in inventory levels.