Indicators
Indicators
Value
Direction
MACD(12,26,9)
-0.011
Neutral
RSI(14)
68.101
Neutral
STOCH(KDJ)(9,3,3)
69.872
Neutral
ATR(14)
0.205
Low Volatility
CCI(14)
63.085
Neutral
Williams %R
22.243
Buy
TRIX(12,20)
0.265
Sell
StochRSI(14)
25.460
Buy


18.451
Today
+0.23%
5 Days
+0.48%
1 Month
+7.11%
6 Months
+6.73%
Year to Date
+2.47%
1 Year
+0.37%
Opening Price
18.401Previous Closing Price
18.408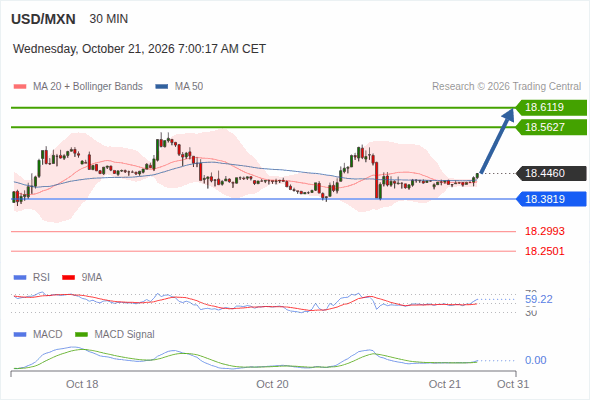
The upside prevails as long as 18.3819 is support, with 18.5627 and 18.6119 as targets
below 18.3819, expect 18.2993 and 18.2501.
The upside prevails as long as 18.3819 is support, with 18.5627 and 18.6119 as targets
The Mexican Peso holds firm against the US Dollar on Tuesday, amid a light economic docket in Mexico, with traders eyeing the release of Mid-Month Inflation figures for October.
• USDMXN rose due to U.S. dollar strength and elevated Treasury yields. • Narrowing interest rate differentials reduced the Mexican peso's carry-trade appeal. • Technical indicators show a MACD buy signal and Williams %R overbought condition.
The Mexican Peso appreciates against the US Dollar amid speculation that the interest rate differential between Mexico and the US will remain unchanged, with the Federal Reserve projected to hold rates steady at the October meeting. The USD/MNX trades at 18.41, down 0.44%.
The Mexican Peso lost ground against the Greenback on Friday amid broader US Dollar weakness, as Mexico’s economic docket is absent, leaving traders leaning into US dynamics. The USD/MXN trades at 18.49, up 0.47%.
The Mexican Peso recovers on Thursday as investors digest the latest US inflation data, which suggests that further tightening is needed but weighs on the US Dollar. The USD/MXN trades at 18.41, down 0.44%.
The Mexican Peso depreciates versus the US Dollar, down some 0.65% on the heels of hot US inflation data, fueling bets that the Federal Reserve could raise rates at the October meeting. The USD/MXN trades at 18.51, after bouncing off daily lows of 18.35.
The Indicators feature provides value and direction analysis for various instruments under a selection of technical indicators, together with a technical summary.
This feature includes nine of the commonly used technical indicators: MACD, RSI, KDJ, StochRSI, ATR, CCI, WR, TRIX and MA. You may also adjust the timeframe depending on your needs.
Please note that technical analysis is only part of investment reference, and there is no absolute standard for using numerical values to assess direction. The results are for reference only, and we are not responsible for the accuracy of the indicator calculations and summaries.