Indicators
Indicators
Value
Direction
MACD(12,26,9)
-797.000
Sell
RSI(14)
43.956
Neutral
STOCH(KDJ)(9,3,3)
38.722
Buy
ATR(14)
2259.286
Low Volatility
CCI(14)
-32.533
Neutral
Williams %R
58.096
Sell
TRIX(12,20)
-0.336
Sell
StochRSI(14)
100.000
Buy
63930.000
Today
+0.55%
5 Days
-2.18%
1 Month
-9.75%
6 Months
+19.67%
Year to Date
+26.88%
1 Year
0.00%
Opening Price
63713.000Previous Closing Price
63594.000The Indicators feature provides value and direction analysis for various instruments under a selection of technical indicators, together with a technical summary.
This feature includes nine of the commonly used technical indicators: MACD, RSI, KDJ, StochRSI, ATR, CCI, WR, TRIX and MA. You may also adjust the timeframe depending on your needs.
Please note that technical analysis is only part of investment reference, and there is no absolute standard for using numerical values to assess direction. The results are for reference only, and we are not responsible for the accuracy of the indicator calculations and summaries.
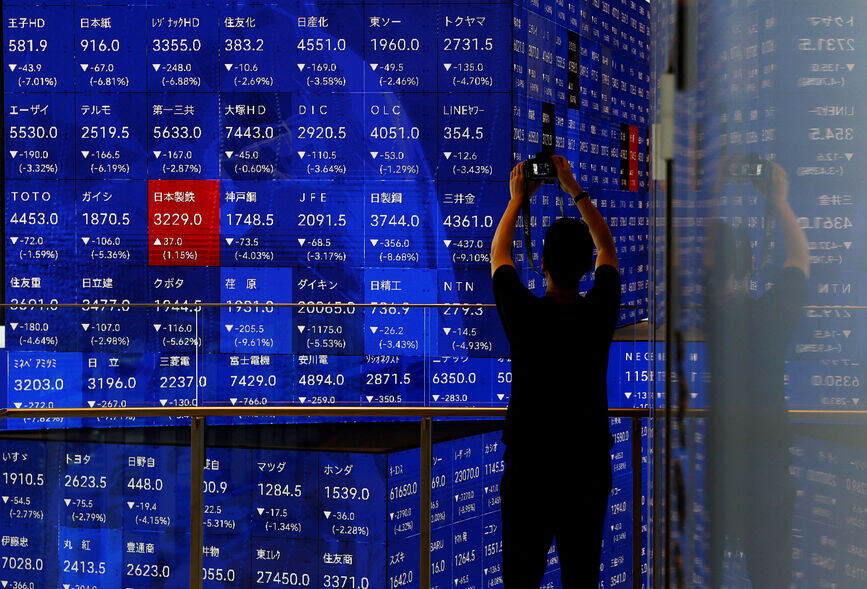
On July 31, Japanese and South Korean stock markets staged a historic rally. South Korea’s KOSPI Index surged 17.91% to close at 6,595.45 points, marking its largest single-day gain since the index's inception. Japan’s Nikkei 225 Index rose 4.03% to close at 64,362.02 points, recovering a portion of

TradingKey - During the Asian trading session on July 31, Japanese and South Korean stock markets staged a sharp rebound, with SK Hynix surging more than 27% and Samsung rising over 22%.
TradingKey - On July 30, the closing performance of Japanese and South Korean stock markets continued to diverge. SK Hynix fell by more than 5%, Samsung dropped nearly 1%, and Kioxia rose nearly 3%.
TradingKey - During the Asian trading session on July 30, Japanese and South Korean stock markets diverged in early trading. SK Hynix fell nearly 5%, Samsung rose more than 1%, and Kioxia climbed over 5%.
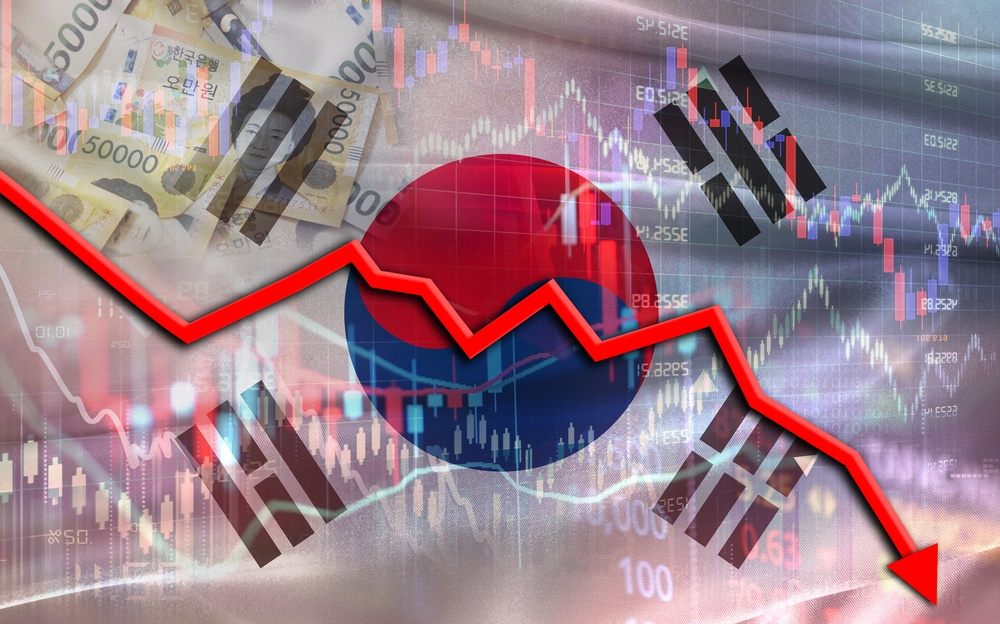
TradingKey - On July 29, Japanese and South Korean stock markets extended their decline, with the South Korean market once again becoming the hardest-hit area in Asian equities. Samsung Electronics fell over 5%, SK Hynix dropped nearly 10%, Kioxia plummeted nearly 14%, and SoftBank fell nearly 7%.
TradingKey - In early Asian trading on July 29, Japanese and South Korean stock markets rebounded following a sharp continuous correction the previous day. SK Hynix rose more than 3% after releasing its earnings report, Samsung Electronics gained over 4%, and Kioxia surged more than 7%.