

Indicators
Indicators
Value
Direction
MACD(12,26,9)
0.002
Buy
RSI(14)
60.791
Neutral
STOCH(KDJ)(9,3,3)
74.046
Buy
ATR(14)
0.005
Low Volatility
CCI(14)
121.781
Buy
Williams %R
30.144
Buy
TRIX(12,20)
0.066
Sell
StochRSI(14)
64.676
Sell
0.586
Today
-0.42%
5 Days
+1.33%
1 Month
+3.00%
6 Months
-2.22%
Year to Date
+1.89%
1 Year
-0.88%
Opening Price
0.590Previous Closing Price
0.589The Indicators feature provides value and direction analysis for various instruments under a selection of technical indicators, together with a technical summary.
This feature includes nine of the commonly used technical indicators: MACD, RSI, KDJ, StochRSI, ATR, CCI, WR, TRIX and MA. You may also adjust the timeframe depending on your needs.
Please note that technical analysis is only part of investment reference, and there is no absolute standard for using numerical values to assess direction. The results are for reference only, and we are not responsible for the accuracy of the indicator calculations and summaries.
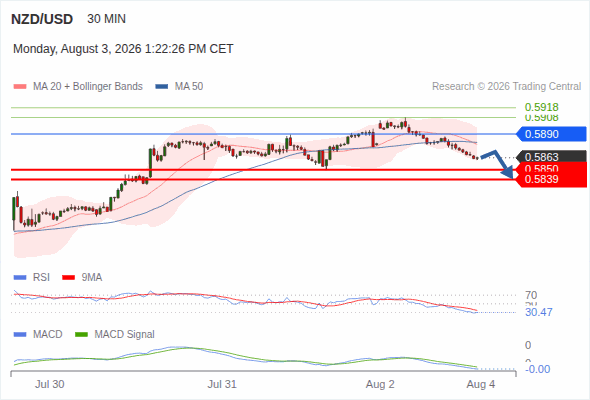
The downside prevails as long as 0.5890 is resistance, with 0.5850 and 0.5839 as targets
above 0.5890, look for 0.5908 and 0.5918.
The downside prevails as long as 0.5890 is resistance, with 0.5850 and 0.5839 as targets
NZD/USD trades around 0.5870 on Monday at the time of writing, down 0.11% on the day.

The NZD/USD pair holds positive ground near 0.5890 during the Asian trading hours on Monday. The New Zealand Dollar (NZD) remains firm despite the downbeat Chinese economic data.

The Kiwi Dollar extends its three-day rally, climbing above 0.5850 and is poised to challenge 0.5900 amid improving risk appetite and broad US Dollar weakness. The clearance of the 200-day Simple Moving Average (SMA) supports the bullish trend, as traders eye the May monthly high at 0.5995.

NZD/USD trades around 0.5860 on Friday, down 0.33% on the day, as investors react to another deterioration in Chinese business activity.

The New Zealand Dollar (NZD) ticks lower against the US Dollar (USD) on Friday, but remains steady near eight-week highs at 0.5885, with downside attempts contained above a previous resistance area at 0.5860 so far.

NZD/USD loses ground after three days of gains, trading around 0.5870 during the Asian hours on Friday. Traders are treading cautiously while awaiting the release of China's Purchasing Managers Index (PMI) data scheduled for later in the day.

Popular Instruments