tradingkey.logo
tradingkey.logo
Search

USD/CAD

USDCAD
Add to Watchlist

1.386

-0.001-0.07%
TradingKey Chart
Time
1m
15m
30m
1h
4h
D
W
D

Today

-0.06%

5 Days

-0.52%

1 Month

-1.28%

6 Months

+1.65%

Year to Date

+0.99%

1 Year

+0.30%

Key Data Points

Opening Price

1.387

Previous Closing Price

1.387
Price Range of the Day
1.3851.387
52-Week Price Range
1.3481.425

Recent

Analysis

Canadian Dollar: CPI and US tariffs weigh on outlook – BBH

Brown Brothers Harriman’s (BBH) Elias Haddad expects Canada’s July Consumer Price Index (CPI) to keep core inflation below 2%, reinforcing an extended Bank of Canada (BoC) pause.

Fxstreet5 minutes ago

Canada CPI expected to show rising inflation in July

Canada’s July Consumer Price Index (CPI) figures will be the focus of attention when published on Monday.

Fxstreetan hour ago

Canadian Dollar: Data and tariffs shape near-term risks – TD Securities

TD Securities’ Robert Both and Emma Lawrence highlight that markets are watching Canadian CPI and potential US Section 338 tariffs on CAD exports. They expect headline CPI at 2.9% year-on-year in July with core at 1.85%, and see retail sales flat in June.

Fxstreet2 hours ago

Canadian Dollar edges higher as Fed rate hike bets recede, CPI data looms

The USD/CAD pair edges lower to around 1.3860 during the early European session on Monday. The US Dollar (USD) extends the decline against the Canadian Dollar (CAD) as traders pare bets on the US Federal Reserve (Fed) rate hikes.

Fxstreet2 hours ago

Canadian Dollar advances due to softer US Dollar, higher oil prices

USD/CAD extends its losses for the third consecutive day, trading around 1.3870 during the Asian hours on Monday. The pair depreciates as the US Dollar (USD) declines amid weaker-than-expected US economic data and shifting central bank expectations.

Fxstreet7 hours ago

USD/CAD Price Forecast: Bears target the 200-day SMA

USD/CAD extends its decline farther below 1.4000 on Friday and heads for a third consecutive weekly loss. At the time of writing, the pair trades around 1.3877, at levels last seen in early July.

FxstreetFri, Aug 14

Indicators

The Indicators feature provides value and direction analysis for various instruments under a selection of technical indicators, together with a technical summary.

This feature includes nine of the commonly used technical indicators: MACD, RSI, KDJ, StochRSI, ATR, CCI, WR, TRIX and MA. You may also adjust the timeframe depending on your needs.

Please note that technical analysis is only part of investment reference, and there is no absolute standard for using numerical values to assess direction. The results are for reference only, and we are not responsible for the accuracy of the indicator calculations and summaries.


1m
5m
15m
30m
1h
2h
4h
D
W
M
1m
5m
15m
D
Sell
Sell(10)
Neutral(0)
Buy(1)
Indicators
Sell(5)
Neutral(0)
Buy(0)
Indicators
Value
Direction
MACD(12,26,9)
-0.004
Sell
RSI(14)
28.738
Sell
STOCH(KDJ)(9,3,3)
4.764
Oversold
ATR(14)
0.006
Low Volatility
CCI(14)
-137.365
Sell
Williams %R
97.671
Oversold
TRIX(12,20)
-0.055
Sell
StochRSI(14)
0.000
Sell
Moving Average
Sell(5)
Neutral(0)
Buy(1)
Indicators
Value
Direction
MA5
1.390
Sell
MA10
1.395
Sell
MA20
1.401
Sell
MA50
1.407
Sell
MA100
1.392
Sell
MA200
1.385
Buy

USD/CAD Trading Strategy

Intraday
Medium Term
Short Term
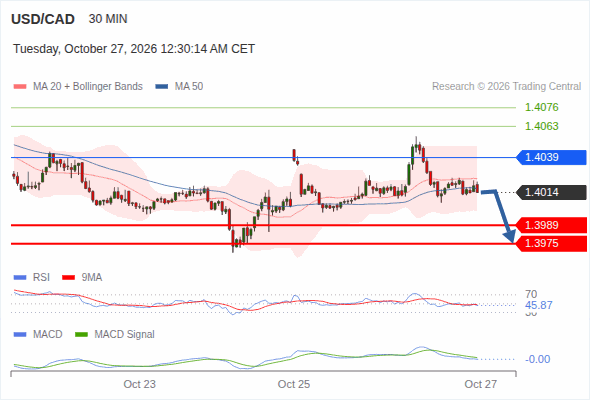
The downside prevails as long as 1.3899 is resistance, with 1.3843 and 1.3830 as targets

Trading Strategy

The downside prevails as long as 1.3899 is resistance, with 1.3843 and 1.3830 as targets

Alternative scenario

above 1.3899, look for 1.3920 and 1.3932.

Comment

The downside prevails as long as 1.3899 is resistance, with 1.3843 and 1.3830 as targets

an hour ago
Source: Trading Central(Reference Only)

More Details of USD/CAD

USD/CAD represents the exchange rate between the U.S. dollar (USD) and the Canadian dollar (CAD). It is one of the most traded currency pairs in the foreign exchange market, reflecting the economic relationship between the United States and Canada. Factors such as interest rates, economic data releases, and geopolitical events can influence this currency pair. Traders and investors closely monitor USD/CAD for opportunities in forex trading, as it often exhibits liquidity and volatility.

What is the best time to trade USD/CAD?

The best times are typically when both U.S. and Canadian markets are open, often during the overlap of trading hours.

How does oil price affect USD/CAD?

Since Canada is a major oil exporter, rising oil prices generally strengthen the CAD against the USD.

Why is USD/CAD important?

It reflects the economic relationship between the U.S. and Canada, influencing trade, investment, and economic policies.

USD/CAD

1.386
-0.001-0.07%
tradingkey.logo
Risk Warning: Our Website and Mobile App provides only general information on certain investment products. Finsights does not provide, and the provision of such information must not be construed as Finsights providing, financial advice or recommendation for any investment product.
Investment products are subject to significant investment risks, including the possible loss of the principal amount invested and may not be suitable for everyone. Past performance of investment products is not indicative of their future performance.
Finsights may allow third party advertisers or affiliates to place or deliver advertisements on our Website or Mobile App or any part thereof and may be compensated by them based on your interaction with the advertisements.
© Copyright: FINSIGHTS MEDIA PTE. LTD. All Rights Reserved.