USD/ZAR
USDZAR16.024USD
Today
-1.35%
5 Days
-0.49%
1 Month
-1.98%
6 Months
-9.65%
Year to Date
-3.18%
1 Year
-13.01%
Key Data Points
Opening Price
16.250Previous Closing Price
16.244Indicators
The Indicators feature provides value and direction analysis for various instruments under a selection of technical indicators, together with a technical summary.
This feature includes nine of the commonly used technical indicators: MACD, RSI, KDJ, StochRSI, ATR, CCI, WR, TRIX and MA. You may also adjust the timeframe depending on your needs.
Please note that technical analysis is only part of investment reference, and there is no absolute standard for using numerical values to assess direction. The results are for reference only, and we are not responsible for the accuracy of the indicator calculations and summaries.
USD/ZAR Trading Strategy

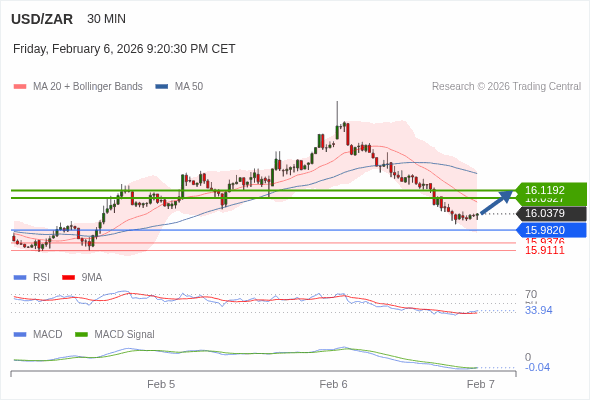
Trading Strategy
The configuration is mixed.
Alternative scenario
below 15.9820, expect 15.9376 and 15.9111.
Comment
rebound towards 16.1192
USD/ZAR News
USD/ZAR: Downtrend persists with targets ahead – Societe Generale
Societe Generale's report highlights the ongoing downtrend in USD/ZAR, noting a break below recent consolidation levels. The report suggests that the pair could drift towards projections near 15.25 and the lower limit of a multi-month descending channel at 15.00/14.70.

USD/ZAR resumes downtrend after brief pause – Société Générale
USD/ZAR has resumed its downward trajectory after slipping below key support levels, with potential targets at 16.10 and 15.90-15.75, Société Générale's FX analysts note.

South Africa Retail Sales (YoY) climbed from previous 2.9% to 3.5% in November
South Africa Retail Sales (YoY) climbed from previous 2.9% to 3.5% in November

South Africa Consumer Price Index (MoM) climbed from previous -0.1% to 0.2% in December
South Africa Consumer Price Index (MoM) climbed from previous -0.1% to 0.2% in December

South Africa Consumer Price Index (YoY) meets expectations (3.6%) in December
South Africa Consumer Price Index (YoY) meets expectations (3.6%) in December

South Africa Consumer Price Index (MoM) dipped from previous 0.1% to -0.1% in November
South Africa Consumer Price Index (MoM) dipped from previous 0.1% to -0.1% in November

More Details of USD/ZAR
Are there any seasonal trends in the USD/ZAR pair?
How is USD/ZAR affected by U.S. economic reports?
Is USD/ZAR a popular pair for forex trading?
Related Instruments
Popular Symbols


