Ethereum
ETHUSD1971.050USD
Today
-0.03%
5 Days
-5.41%
1 Month
-34.92%
6 Months
-53.49%
Year to Date
-33.84%
1 Year
-25.36%
Key Data Points
Opening Price
1970.370Previous Closing Price
1971.640Indicators
The Indicators feature provides value and direction analysis for various instruments under a selection of technical indicators, together with a technical summary.
This feature includes nine of the commonly used technical indicators: MACD, RSI, KDJ, StochRSI, ATR, CCI, WR, TRIX and MA. You may also adjust the timeframe depending on your needs.
Please note that technical analysis is only part of investment reference, and there is no absolute standard for using numerical values to assess direction. The results are for reference only, and we are not responsible for the accuracy of the indicator calculations and summaries.
Ethereum Trading Strategy

Trading Strategy
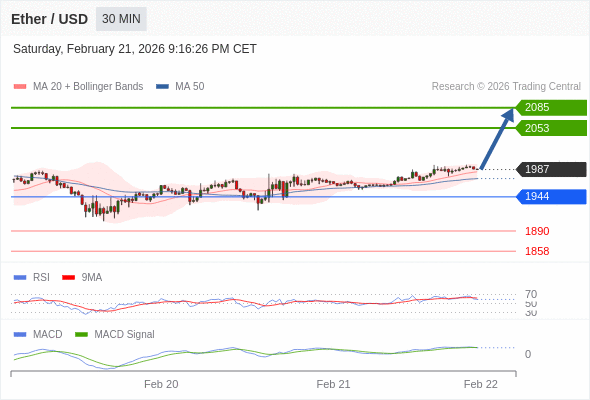
Our preference: as long as 1944 is support look for 2085.
Alternative scenario
the downside breakout of 1944 would call for 1890 and 1858.
Comment
as long as 1944 is support look for 2085.
Ethereum News
Ethereum Price Forecast: Vitalik Buterin hints at cypherpunk 'Bolt-On' upgrade for L1
Ethereum co-founder Vitalik Buterin has sparked excitement in the crypto community with his latest vision for the blockchain's future.

Crypto Today: Bitcoin, Ethereum, XRP rebound as risk appetite improves
Bitcoin (BTC) rises marginally, nearing the immediate resistance of $68,000 at the time of writing on Friday. Major altcoins, including Ethereum (ETH) and Ripple (XRP), hold key support levels as bulls aim to maintain marginal intraday gains.

Top 3 Price Prediction: Bitcoin, Ethereum, Ripple – BTC, ETH and XRP remain range-bound as breakdown risks rise
Bitcoin (BTC), Ethereum (ETH), and Ripple (XRP) are trading sideways within consolidation ranges on Friday, signaling a lack of directional bias in the broader crypto market.

Ethereum Price Forecast: Active addresses halt growth as US selling pressure eases
Ethereum (ETH) network growth has stalled over the past week, halting an explosive rise over the past two months.

Crypto Today: Bitcoin, Ethereum, XRP extend consolidation amid shrinking ETF balances
The cryptocurrency market is trading amid mixed signals, with major coins such as Bitcoin (BTC), Ethereum (ETH) and Ripple (XRP) showing subtle but broader risk-off sentiment, and keeping investors on the sidelines.

CEX vs. DEX 2026: Who Wins the Battle for the Ultimate Trading Experience?
Explore the 2026 CEX vs. DEX landscape. Compare Coinbase and Kraken’s regulatory gold standard against Uniswap v4 and ChangeNOW’s non-custodial innovation for the ultimate trading experience.


