tradingkey.logo
XAUUSD

USD/NOK

USDNOK
View Detailed Chart

9.90564NOK

+0.01736+0.18%
Time
1m
15m
30m
1h
4h
D
W
Please select

Today

+0.18%

5 Days

-1.87%

1 Month

-4.83%

6 Months

-11.00%

Year to Date

-12.74%

1 Year

-6.65%

View Detailed Chart

Key Data Points

Opening Price

9.8722

Previous Closing Price

9.88828
Price Range of the Day
9.866789.92270
52-Week Price Range
0.000009.90564

Indicators

The Indicators feature provides value and direction analysis for various instruments under a selection of technical indicators, together with a technical summary.

This feature includes nine of the commonly used technical indicators: MACD, RSI, KDJ, StochRSI, ATR, CCI, WR, TRIX and MA. You may also adjust the timeframe depending on your needs.

Please note that technical analysis is only part of investment reference, and there is no absolute standard for using numerical values to assess direction. The results are for reference only, and we are not responsible for the accuracy of the indicator calculations and summaries.

1m
5m
15m
30m
1h
2h
4h
D
W
M
1m
5m
15m
D
Sell
Sell(9)
Neutral(1)
Buy(1)
Indicators
Sell(3)
Neutral(1)
Buy(1)
Indicators
Value
Direction
MACD(12,26,9)
-0.023
Sell
RSI(14)
35.960
Neutral
STOCH(KDJ)(9,3,3)
10.637
Oversold
ATR(14)
0.101
High Vlolatility
CCI(14)
-183.374
Sell
Williams %R
86.343
Oversold
TRIX(12,20)
-0.137
Sell
StochRSI(14)
26.066
Buy
Moving Average
Sell(6)
Neutral(0)
Buy(0)
Indicators
Value
Direction
MA5
9.972
Sell
MA10
10.032
Sell
MA20
10.091
Sell
MA50
10.307
Sell
MA100
10.608
Sell
MA200
10.804
Sell

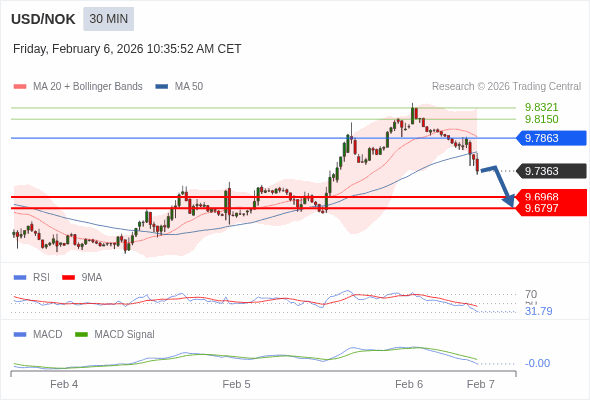
USD/NOK Trading Strategy

Intraday
Short Term
The MACD must penetrate its zero line to expect further downside.

Trading Strategy

The MACD must penetrate its zero line to expect further downside.

Alternative scenario

above 9.9916, look for 10.0369 and 10.0639.

Comment

under pressure below 9.9916

Fri, Jun 13
Source: Trading Central(Reference Only)

USD/NOK News

EUR/NOK pulls back from multi-year highs – Société Générale

EUR/NOK is retreating after failing to break above the key resistance zone of 12.05–12.12, marking last year's highs. The pair has established a short-term floor near 11.43 but lacks momentum for a strong rebound.

FxstreetTue, Jun 10
EUR/NOK is retreating after failing to break above the key resistance zone of 12.05–12.12, marking last year's highs. The pair has established a short-term floor near 11.43 but lacks momentum for a strong rebound.

EUR/NOK rejected at key multiyear resistance – Société Générale

EUR/NOK is retreating after a failed breakout above 12.05, with focus shifting to support near the 50-DMA and downside targets at 11.60 and 11.45, Société Générale's FX analysts note.

FxstreetThu, May 8
EUR/NOK is retreating after a failed breakout above 12.05, with focus shifting to support near the 50-DMA and downside targets at 11.60 and 11.45, Société Générale's FX analysts note.

Norges Bank likely to delay cuts until June – Commerzbank

Although the Norwegian inflation figures for March look a little better again after the significant upward surprise at the beginning of the year, Norges Bank is still likely to wait until June before lowering the key rate, Commerzbank's FX analyst Antje Praefcke notes.

FxstreetTue, Apr 15
Although the Norwegian inflation figures for March look a little better again after the significant upward surprise at the beginning of the year, Norges Bank is still likely to wait until June before lowering the key rate, Commerzbank's FX analyst Antje Praefcke notes.

EUR/NOK fails to hold breakout – Societe Generale

EUR/NOK's recent breakout attempt above 12.05 was short-lived, as strong resistance pushed the pair back into its consolidation range. Key support at 11.68 now becomes critical for the near-term outlook, Societe Generale's FX analysts report.

FxstreetThu, Apr 10
EUR/NOK's recent breakout attempt above 12.05 was short-lived, as strong resistance pushed the pair back into its consolidation range. Key support at 11.68 now becomes critical for the near-term outlook, Societe Generale's FX analysts report.

NOK: Vulnerable to the liquidity shock – ING

After the Australian dollar, the Norwegian krone has been the worst-performing G10 currency over the last week, ING's FX analyst Chris Turner notes.

FxstreetMon, Apr 7
After the Australian dollar, the Norwegian krone has been the worst-performing G10 currency over the last week, ING's FX analyst Chris Turner notes.

Norges Bank to stand pat for the time being – Commerzbank

As we expected, Norges Bank left the policy rate unchanged last week. After all, the interest rate path from December did not necessarily imply an interest rate cut in March.

FxstreetWed, Apr 2
As we expected, Norges Bank left the policy rate unchanged last week. After all, the interest rate path from December did not necessarily imply an interest rate cut in March.

More Details of USD/NOK

USDNOK refers to the exchange rate between the US Dollar (USD) and the Norwegian Krone (NOK). This currency pair is significant for international trade and investment, particularly due to Norway's strong economy, which is heavily influenced by its oil exports. The value of USDNOK is affected by various factors, including economic indicators from both the United States and Norway, interest rate policies, commodity prices (especially oil), and broader geopolitical events. Traders and investors closely monitor this pair to gain insights into economic trends and market dynamics in the Nordic region.
What are the risks associated with trading USDNOK?
Trading USDNOK involves risks such as currency volatility, fluctuations in oil prices, and economic instability in Norway. Traders should also consider geopolitical events and the impact of global market sentiment on the currency pair.
What role do oil prices play in USDNOK?
As a major oil exporter, Norway's economy is closely tied to oil prices. Rising oil prices typically strengthen the NOK against the USD, while falling oil prices can lead to a depreciation of the NOK.
Are there any costs involved in converting USD to NOK?
Yes, converting USD to NOK typically involves several costs: Transaction Fees: Charged by the service provider for executing the transfer. Conversion Fees: Additional fees for the currency conversion process. Spread: The difference between the bid and ask prices for the currency pair, which is how financial institutions often make a profit on currency conversions. It’s beneficial to compare the rates and fees of different service providers to find the most cost-effective solution for your transfer needs.

USD/NOK

9.90564

+0.01736+0.18%
KeyAI