NZD/JPY
NZDJPY94.541USD
Today
+0.99%
5 Days
+1.54%
1 Month
+4.54%
6 Months
+7.88%
Year to Date
+4.81%
1 Year
+10.46%
Key Data Points
Opening Price
93.597Previous Closing Price
93.616Indicators
The Indicators feature provides value and direction analysis for various instruments under a selection of technical indicators, together with a technical summary.
This feature includes nine of the commonly used technical indicators: MACD, RSI, KDJ, StochRSI, ATR, CCI, WR, TRIX and MA. You may also adjust the timeframe depending on your needs.
Please note that technical analysis is only part of investment reference, and there is no absolute standard for using numerical values to assess direction. The results are for reference only, and we are not responsible for the accuracy of the indicator calculations and summaries.
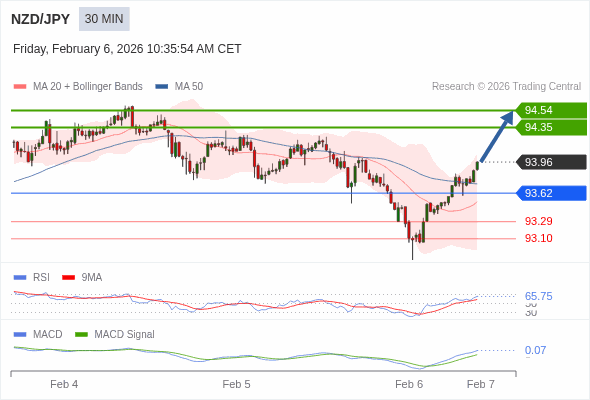
NZD/JPY Trading Strategy

Trading Strategy
The configuration is positive.
Alternative scenario
below 93.62, expect 93.29 and 93.10.
Comment
the upside prevails as long as 93.62 is support
NZD/JPY News
NZD/JPY Price Forecast: Holds above 87.35 on risk-off mood, stays bullish
The NZD/JPY consolidates during the week, although it posted losses of over 0.44% on Tuesday, on solid Japanese economic data. Additionally, the risk-off mood, which has boosted safe-haven peers like the Yen, exerted downward pressure on the cross-pair, which trades at 87.41, virtually unchanged.

NZD/JPY Price Forecast: Surges above key resistance near 88.00
The NZD/JPY rallied sharply and posted gains of over 1%, trading at 87.69 after bouncing off daily lows of 86.56, clearing key technical resistance levels, as the pair seems poised to challenge the year-to-date (YTD) high of 89.71.

NZD/JPY Price Forecast: Climbs on eased US-China tensions
NZD/JPY climbed over 0.75% on Thursday amid a session that witnessed an escalation of the Trump-Musk fight on social media, which ultimately sent Testla (TSLA) stocks plunging over 14% during the day.

NZD/JPY Price Forecast: Pulls back on mixed mood, uptrend faces key test
NZD/JPY retreated after reaching a three-day high of 86.82, dropping towards the 86.00 figure as market appetite turned slightly sour.

NZD/JPY Price Forecast: Holds steady above 86.00 with intact bullish structure
The NZD/JPY begins Tuesday’s Asian session flat after registering minimal gains of over 0.24% on Monday amid a risk-on mood. At the time of writing, the cross-pair trades at 86.13, unchanged.

NZD/JPY Price Forecast: Climbs higher but bulls struggle to clear 86.00 resistance
NZD/JPY extended its rally for the third consecutive day on Tuesday, rose a slim 0.17%, but failed to clear key resistance seen at the Kijun-Sen at 85.92 to challenge the 86.00 figure. As Wednesday’s Asian session begins, the cross-pair trades at 85.81 virtually unchanged.

More Details of NZD/JPY
Is NZD/JPY affected by global market trends?
What are the risks associated with trading NZD/JPY?
Why is NZD/JPY popular among traders?
Related Instruments
Popular Symbols


