

Visa Inc
VToday
+0.27%
5 Days
+1.13%
1 Month
-0.43%
6 Months
-6.99%
Year to Date
-6.62%
1 Year
-3.28%
TradingKey Stock Score of Visa Inc
Currency: USD Updated: 2026-06-22Key Insights
Visa Inc's fundamentals are relatively very healthy, and its growth potential is high.Its valuation is considered fairly valued, ranking 1 out of 488 in the Software & IT Services industry.Institutional ownership is very high.Over the past month, multiple analysts have rated it as Buy, with the highest price target at 398.23.In the medium term, the stock price is expected to remain stable.Despite an average stock market performance over the past month, the company shows strong fundamentals and technicals.The stock price is trading sideways between the support and resistance levels, making it suitable for range-bound swing trading.
Visa Inc's Score
Support & Resistance
Score Analysis
Media Coverage
Visa Inc Highlights
Visa Inc. is a leading American multinational corporation specializing in payment card services, with its headquarters situated in San Francisco, California. The company facilitates electronic funds transfers globally, primarily through Visa-branded credit cards, debit cards, and prepaid cards.
Visa itself does not issue cards, extend credit, or establish rates and fees for consumers; instead, it provides financial institutions with Visa-branded payment products that these institutions utilize to offer credit, debit, prepaid, and cash access programs to their clients.
Founded in 1958 by Bank of America as the BankAmericard credit card program, Visa evolved in response to the rise of competitor Master Charge. In 1966, BofA began licensing the BankAmericard program to other financial institutions. By 1970, BofA relinquished direct control over the BankAmericard program, forming a cooperative with various BankAmericard issuer banks to assume its management. This cooperative was renamed Visa in 1976.
Virtually all Visa transactions worldwide are processed through the company’s proprietary VisaNet at one of four secure data centers located in Ashburn, Virginia, and Highlands Ranch, Colorado, in the United States; London, England; and Singapore. These facilities are fortified against natural disasters, crime, and terrorism, can operate autonomously from each other and external utilities if required, and are capable of handling up to 30,000 simultaneous transactions along with 100 billion computations per second.
As of 2015, Visa became the world's second-largest card payment organization, having been surpassed by China UnionPay in terms of the annual value of card payments processed and the number of cards issued. However, since UnionPay's size is mainly derived from its domestic market in China, Visa remains the dominant bankcard firm outside of China, holding a substantial 50% market share of total card payments globally.
Analyst Rating
Visa Inc News
2026 World Cup in US, Canada, Mexico Starts. Which Industry Stocks Are Expected to Benefit?
Tradingkey - The opening match of the 2026 FIFA World Cup will officially kick off on June 11, with the tournament running until July 19 across 16 cities in the United States, Canada, and Mexico. Investment banks Deutsche Bank and Goldman Sachs noted that the World Cup will serve as a major catalyst for various consumer, media, and betting stocks, particularly generating clear incremental earnings growth in sectors such as tourism, catering, and sports betting.

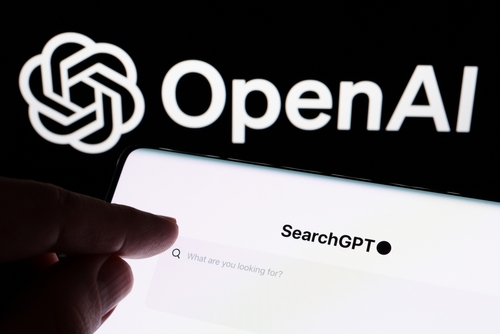
OpenAI Partners With Visa, AI Agent Gains ‘Payment Capability’ for the First Time
TradingKey - OpenAI and Visa (V) jointly announced on Wednesday the integration of Visa payment services into the OpenAI platform, enabling AI agents to autonomously complete online purchases and payments upon user authorization. This is a further expansion of a previous cooperation agreement between the two companies. At the application level, users can instruct AI agents to perform tasks such as bill payments and grocery shopping, while online retailers will support transaction requests initiated by AI agents. As the AI platform with the highest brand recognition among consumers, ChatGPT will serve as the primary entry point for the implementation of this payment capability.
Will Thanksgiving Spending Be the Catalyst the Market Needs?
TradingKey - Heading into the holiday stretch, the U.S. market is still limping. November—a month that typically brings seasonality-driven gains—has stalled out.

Visa 3Q25 Earnings Comment: Resilient Spending but Valuation is Already High
TradingKey - Visa once again beat the estimates for EPS and revenue, which is a good thing, as it shows certain resilience in macro spending. The volume of payments was also up 8% on a yearly basis. Even within the cross-border segment, we see solid results (12% increase in cross-border volume)...
Visa: The Payment Titan Conquering the Stablecoin Storm
Visa, as a global leader in payment technology, leverages its robust VisaNet network and operations spanning over 200 countries, processing trillions of transactions annually, showcasing exceptional resilience and growth potential. In 2024, its earnings per share reached $9.74, up 17.51%, driven by
Visa Q2 FY2025: Infrastructure-Grade Moat or Earnings Mirage?
TradingKey - Visa's (V) Q2 FY2025 results reinforce its position not only as a payments processor, but also as the embedded trust layer of global commerce. While the market views Visa as a mature, low-growth financial stock, its fundamentals highlight a platform increasingly integral...
Financial Indicators
EPS
Total revenue
Visa Inc Info
Visa Inc. is a leading American multinational corporation specializing in payment card services, with its headquarters situated in San Francisco, California. The company facilitates electronic funds transfers globally, primarily through Visa-branded credit cards, debit cards, and prepaid cards.
Visa itself does not issue cards, extend credit, or establish rates and fees for consumers; instead, it provides financial institutions with Visa-branded payment products that these institutions utilize to offer credit, debit, prepaid, and cash access programs to their clients.
Founded in 1958 by Bank of America as the BankAmericard credit card program, Visa evolved in response to the rise of competitor Master Charge. In 1966, BofA began licensing the BankAmericard program to other financial institutions. By 1970, BofA relinquished direct control over the BankAmericard program, forming a cooperative with various BankAmericard issuer banks to assume its management. This cooperative was renamed Visa in 1976.
Virtually all Visa transactions worldwide are processed through the company’s proprietary VisaNet at one of four secure data centers located in Ashburn, Virginia, and Highlands Ranch, Colorado, in the United States; London, England; and Singapore. These facilities are fortified against natural disasters, crime, and terrorism, can operate autonomously from each other and external utilities if required, and are capable of handling up to 30,000 simultaneous transactions along with 100 billion computations per second.
As of 2015, Visa became the world's second-largest card payment organization, having been surpassed by China UnionPay in terms of the annual value of card payments processed and the number of cards issued. However, since UnionPay's size is mainly derived from its domestic market in China, Visa remains the dominant bankcard firm outside of China, holding a substantial 50% market share of total card payments globally.
Related Instruments
Popular Instruments
