

How does TradingKey Stock Score form its data-powered insights?
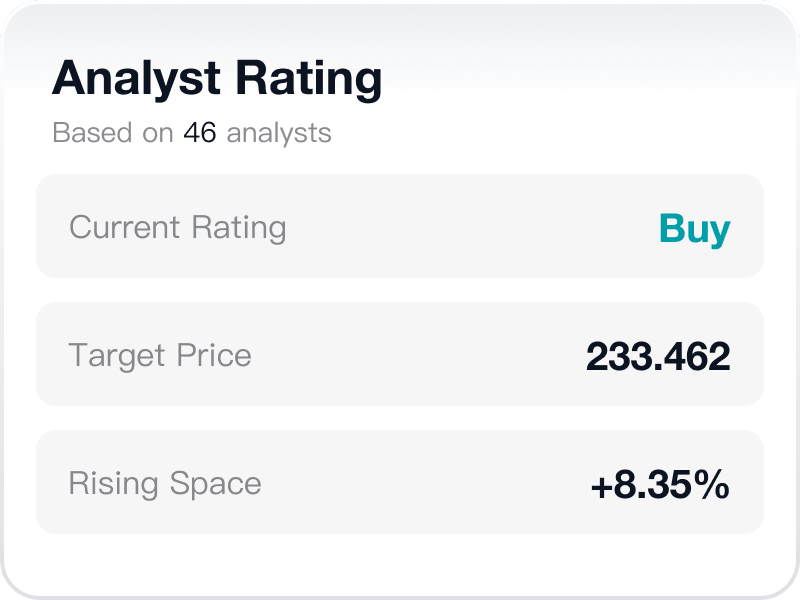
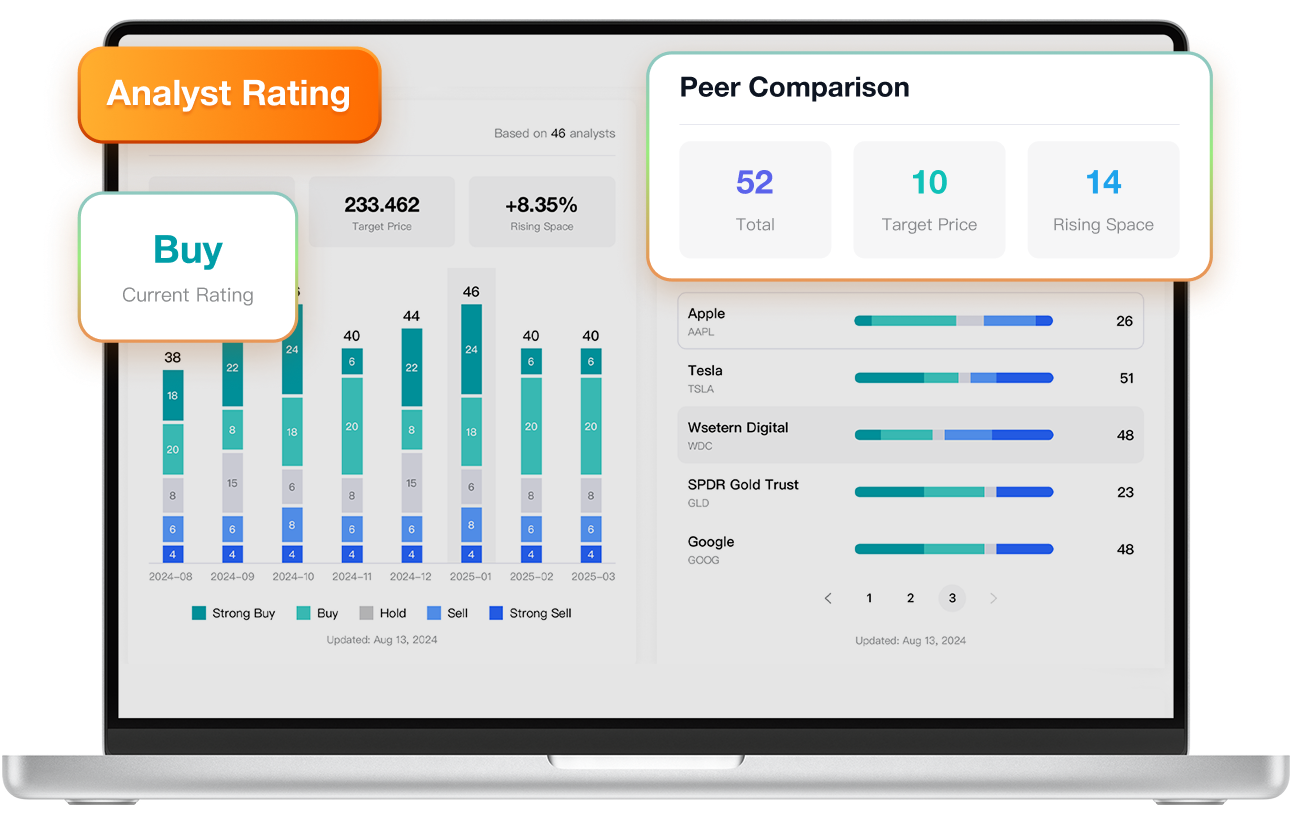
Instant Business Overview

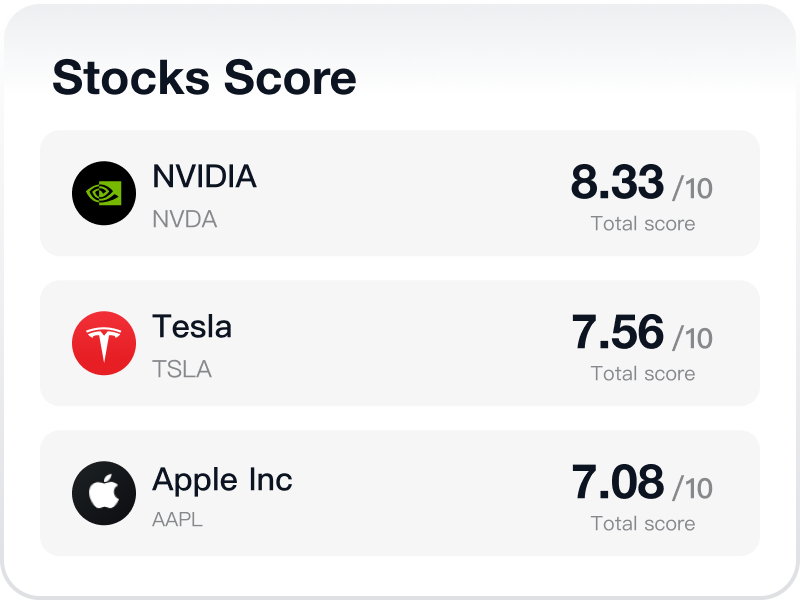
Assess a Stock in 30 Seconds

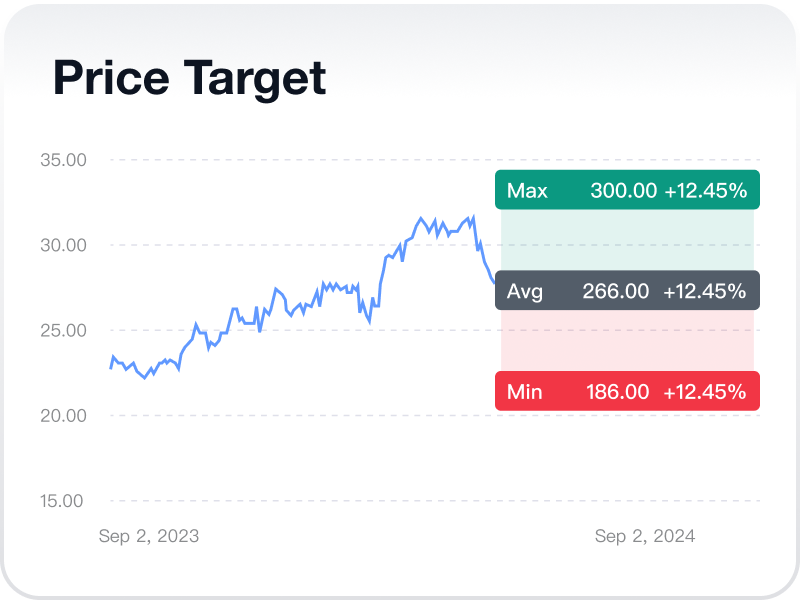
Dynamic Price Analysis

Comprehensive Investment Guide

Why should you use TradingKey Stock Score?

All-in-One Solution

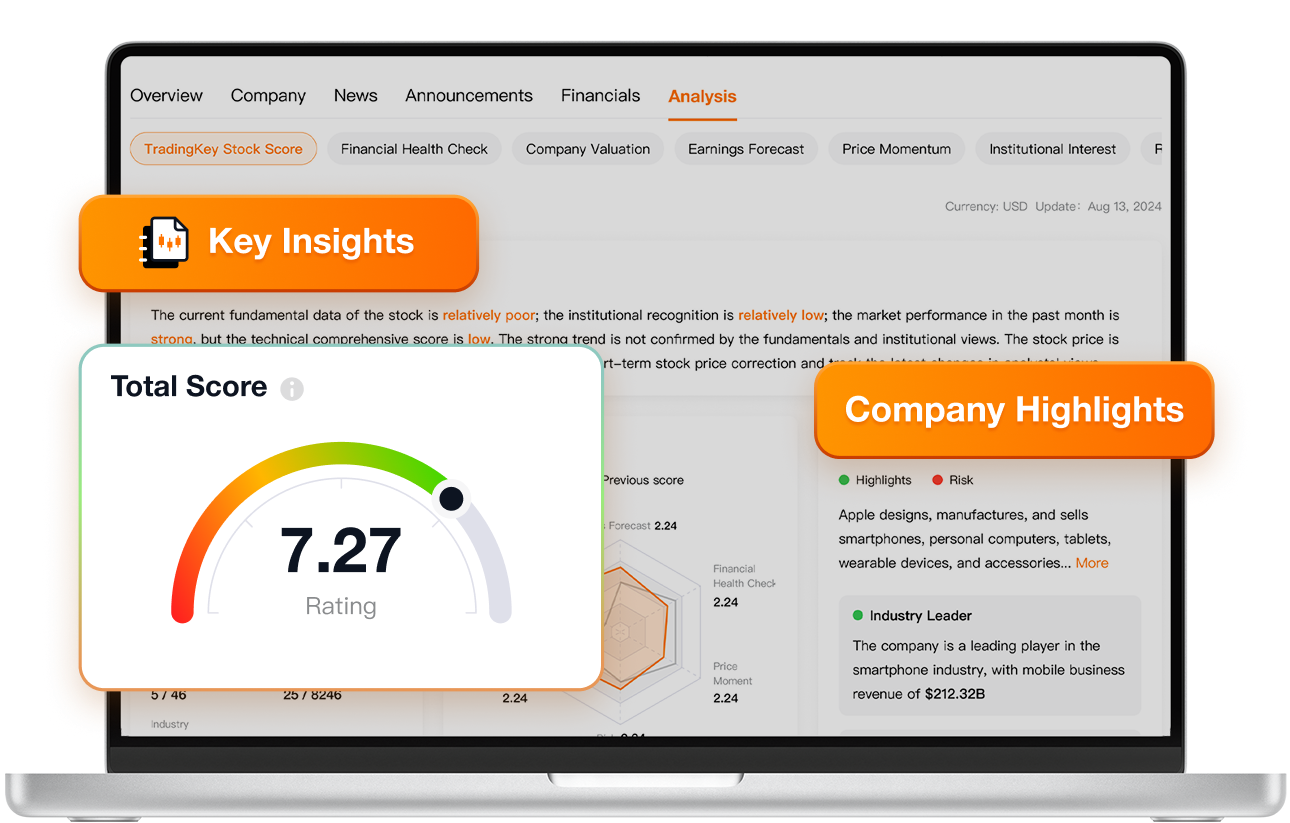
In-Depth Diagnostics

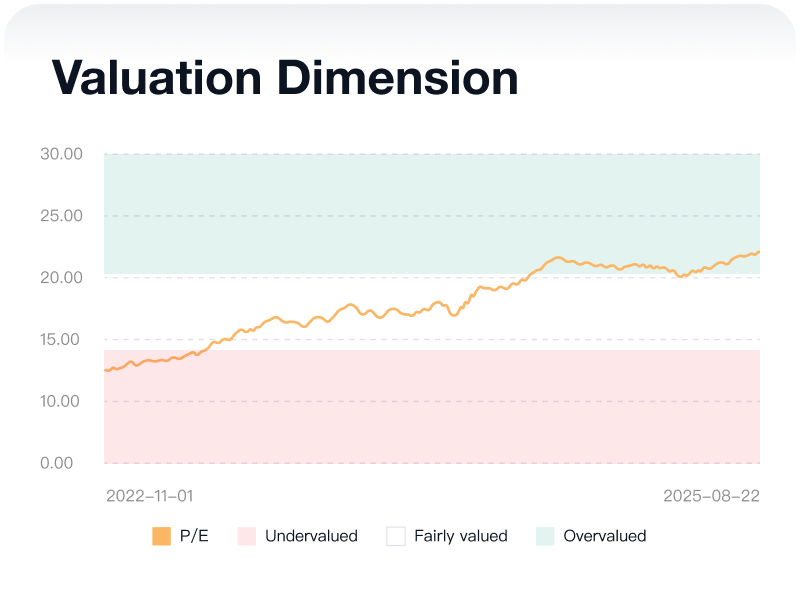
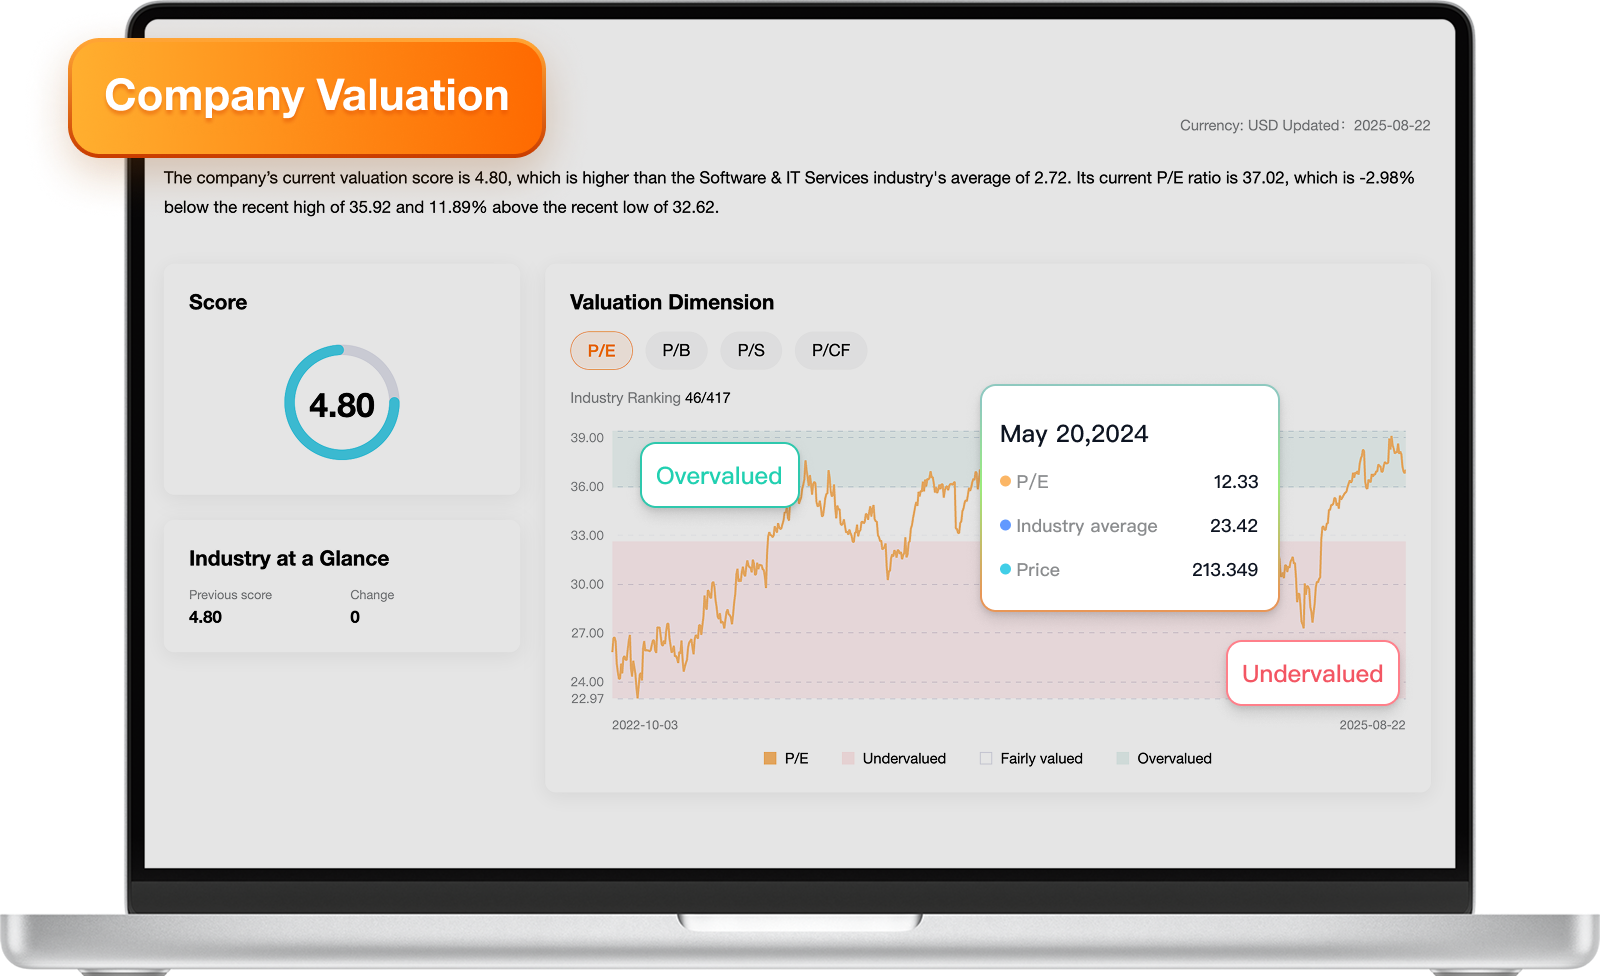
Advanced Valuation Tools
Discover Smarter Stock Insights
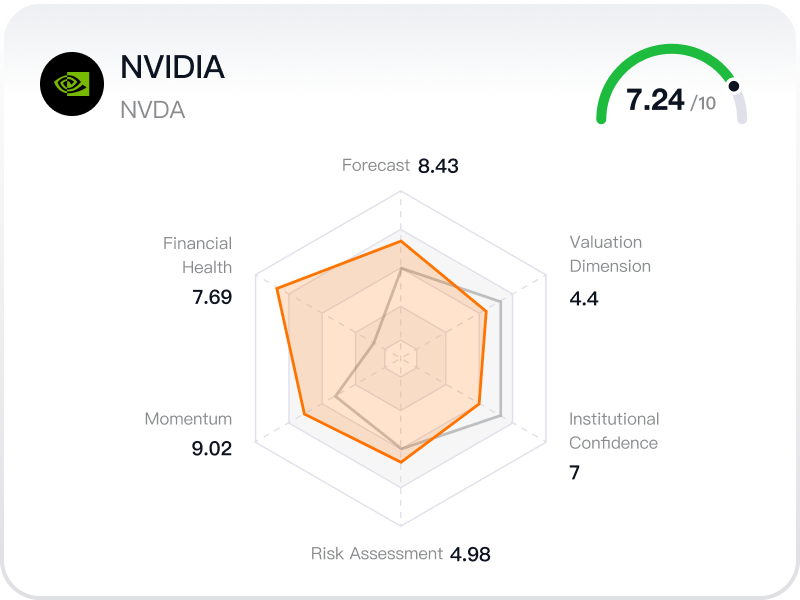
TradingKey Stock Score evaluates every stock using 34 indicators built from over 100 underlying metrics. These indicators are grouped into six key dimensions that together provide a comprehensive view of each company.


Financial Health
Company Valuation
Earnings Forecast
Price Momentum
Institutional Confidence
Risk Assessment
Each score is back-tested with rigorous models and cross-validated for reliability, giving you a data-driven foundation to make better investment decisions with confidence.Companies across different industries are evaluated differently. On top of that, the TradingKey research team continually enhances the Stock Score formula to keep pace with evolving market conditions and better serve the needs of investors.
FAQs
1. What is “Stock Score”? How can it help me?
The TradingKey Stock Score is a scoring methodology that evaluates the investability of any stock or company by assigning it a clear, easy-to-understand score.
While TradingKey Stock Score provides a quick overall view, investors can also dive deeper into the individual dimensions that make up the score, allowing you to align analysis with your own investment style.
For example, if you prefer to rely on financial statements and company fundamentals, you can focus specifically on the Financial Health Score to guide your investment decisions.
2. How to use TradingKey Stock Score?
Assess a stock in just 30 seconds!
The TradingKey Stock Score makes investing easier for retail investors by cutting through market noise and providing an objective, data-driven evaluation of each stock.
Every stock is assigned a score from 0 to 10, with a higher score indicating a stronger Buy signal.
The Stock Score updates live whenever there are changes in the underlying metrics and indicators, ensuring investors always have the latest insights.
Our research team continually enhances the Stock Score to keep pace with evolving market conditions and to better serve the needs of investors.
3. What makes TradingKey Stock Score different from other platforms?
TradingKey Stock Scoring system processes more than 34 sophiscated signals covering technical analysis, fundamental metrics and institutional investing patterns. This makes TradingKey Stock Score one of the most comprehensive scoring platforms in the world.
On top of that, the research team at Tradingkey constantly enhances the formula behind Stock Score to keep pace with evolving market conditions and better meet the needs of investors.
4. Where does TradingKey get their data from?
TradingKey partners with trusted, institution-grade financial data providers, including LSEG, to power our data and insights. The data is carefully cleaned, organized, and structured to ensure the highest levels of accuracy and usability for investors.