

Nebius Group NV
NBISToday
-1.04%
5 Days
+9.09%
1 Month
+32.10%
6 Months
+204.31%
Year to Date
+238.94%
1 Year
+491.43%
TradingKey Stock Score of Nebius Group NV
Currency: USD Updated: 2026-06-22Key Insights
Nebius Group NV's fundamentals are relatively very healthy, and its growth potential is high.Its valuation is considered undervalued, ranking 92 out of 161 in the Professional & Commercial Services industry.Institutional ownership is very high.Over the past month, multiple analysts have rated it as Buy, with the highest price target at 232.49.In the medium term, the stock price is expected to trend up.
Nebius Group NV's Score
Support & Resistance
Score Analysis
Media Coverage
Nebius Group NV Highlights
Analyst Rating
Nebius Group NV News
NBIS Stock Nears New High. Nebius Rises Over 5% Premarket, Nearing the $300 Mark Again
Nebius shares rose over 5% but have yet to break through the $300 mark, warranting caution over pullback risks.
Nebius Stock Forecast: How Did NBIS Secure $44B in Contracts and What's Next?
TradingKey - Nebius Group Q1 2026: $399M revenue +684% YoY, EBITDA positive $129.5M. Microsoft $17–19B and Meta $27B contracts. $9.3B cash. 1.2 GW power. NBIS at $253.51. Target $280.
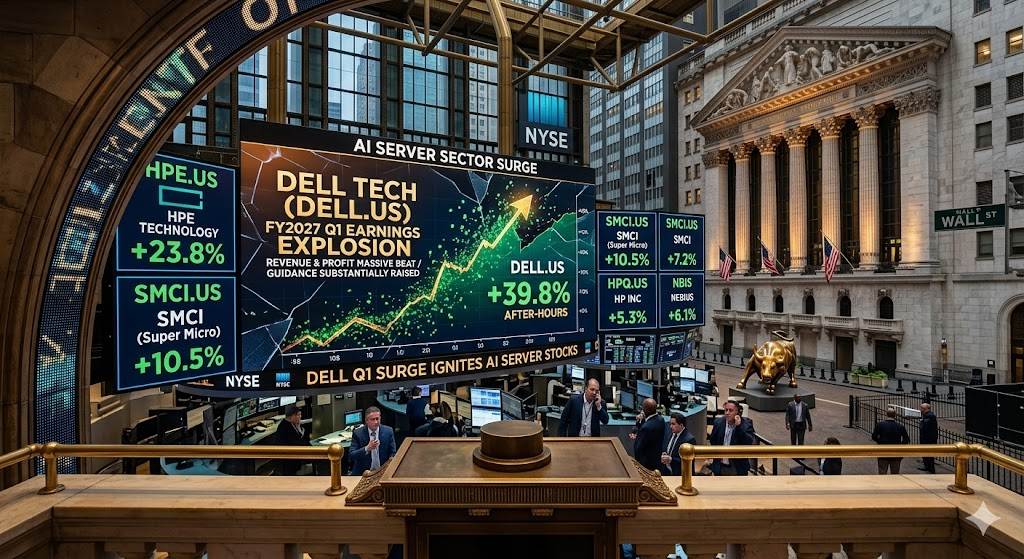
Dell Raises Fiscal Year Profit and Revenue Forecasts, Driving Pre-Market Surge in AI Server Maker Related Stocks
TradingKey - On May 28, Eastern Time, Dell Technologies (DELL.US) delivered blockbuster first-quarter results for fiscal year 2027 after the U.S. market close. Revenue and profit significantly exceeded expectations, and the company substantially raised its full-year financial guidance, driving Dell shares to surge nearly 40% at one point in after-hours trading.
Nebius Surges 8.62%, 'Buffett of AI' Stake Ignites Rally
TradingKey - As of August 28, Eastern Time, AI cloud infrastructure provider Nebius Group (NBIS.US) surged over 11% intraday before closing at $226.34, up 8.62%. The stock continued to rise by more than 1.5% in overnight trading. Year-to-date, the shares have seen a cumulative gain of 170.4%.
Nebius Surges 11% Pre-Market, Former OpenAI Researcher Aschenbrenner Bets Big
TradingKey - Dutch cloud computing provider Nebius Group (NBIS) saw its pre-market share price surge by as much as 11%. The primary catalyst for the rally was a significant equity disclosure from Situational Awareness, an investment firm founded by former OpenAI researcher Leopold Aschenbrenner. According to regulatory filings, the firm holds 12.4 million Class A ordinary shares of Nebius, representing a 5.6% stake and making it one of the company's largest institutional investors.
Is Nebius Group (NBIS) a Buy? Upcoming 2030 Estimates & Predictions Based on Growing AI Infrastructure
Nebius Group (NBIS) is emerging as a high-performance AI cloud leader. Driven by tier-1 partnerships and a shift to "AI utility" software, it faces high valuation risks but offers massive 2030 upside. Analysts view it as a high-conviction, aggressive growth play for the AI infrastructure era.
Financial Indicators
EPS
Total revenue
Nebius Group NV Info
Related Instruments
Popular Instruments
