

Indicators
Indicators
Value
Direction
MACD(12,26,9)
1.868
Neutral
RSI(14)
50.889
Neutral
STOCH(KDJ)(9,3,3)
56.486
Sell
ATR(14)
2.636
High Vlolatility
CCI(14)
27.263
Neutral
Williams %R
29.527
Buy
TRIX(12,20)
0.075
Sell
StochRSI(14)
0.000
Sell
Today
-2.93%
5 Days
-1.16%
1 Month
+5.76%
6 Months
-21.19%
Year to Date
-25.80%
1 Year
-22.81%
PDD Holdings Inc's fundamentals are relatively very healthy, and its growth potential is high.Its valuation is considered fairly valued, ranking 93 out of 485 in the Software & IT Services industry.Institutional ownership is very high.Over the past month, multiple analysts have rated it as Buy, with the highest price target at 118.27.In the medium term, the stock price is expected to trend down.Despite a good stock market performance and outperforming fundamentals over the past month, the technicals don't support the current trend.The stock price is trading sideways between the support and resistance levels, making it suitable for range-bound swing trading.
Media Coverage
TradingKey - U.S. stock index futures rose across the board in pre-market trading on Wednesday ET. The market extended the momentum from the previous session led by AI chip stocks, as investors bet that potential U.S.-Iran negotiations could ease geopolitical risks. Meanwhile, falling oil prices and declining U.S. Treasury yields also supported sentiment for risk assets. As of press time, Dow futures were up 0.1%, Nasdaq 100 index futures rose 0.67%, and S&P 500 index futures gained 0.23%.

TradingKey — Pinduoduo (PDD) will release its first-quarter 2026 financial results before the U.S. market opens on May 27 ET, and will hold an earnings conference call at 7:30 AM ET that same day.

TradingKey - The high-stakes meeting between U.S. President Donald Trump and Chinese President Xi Jinping on Thursday, October 30, stands as the cornerstone of Trump's ongoing five-day Asia trip after returning to the White House. This summit follows a constructive round of trade negotiations, which

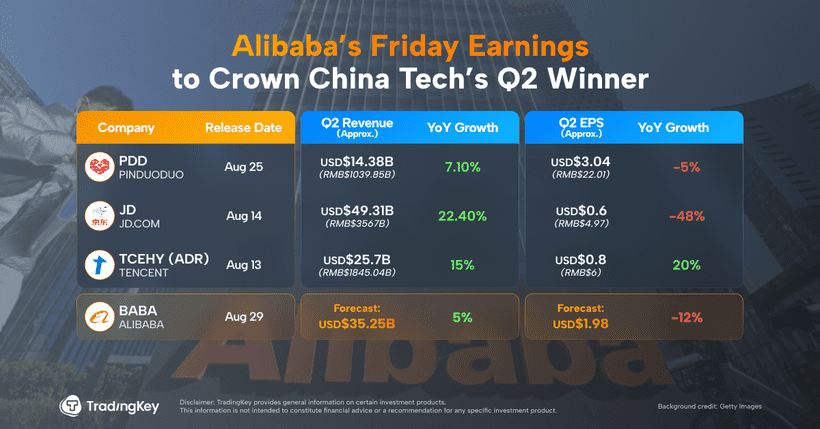
TradingKey - Names like JD.com, Pinduoduo, Tencent, and Alibaba represent the top-tier of Chinese tech stocks trading in the U.S. But their FY2025 Q2 earnings paint very different pictures.
TradingKey - Pinduoduo (PDD) Q1 2025 results don’t look good. The stock fell for several days after earnings, with market sentiment taking a visible hit.
TradingKey - The uncertainty of Trump’s tariff policies is disrupting global markets, making already volatile markets even more unpredictable. This paper analyses multi-assets, sectors, and individual stock strategies to identify reliable investment opportunities in an uncertain political...

Related Instruments
Popular Instruments