

Riding the Tariff Waves: Asset Allocation and Investment Strategies

Authors: Jason Tang, Petar Petrov
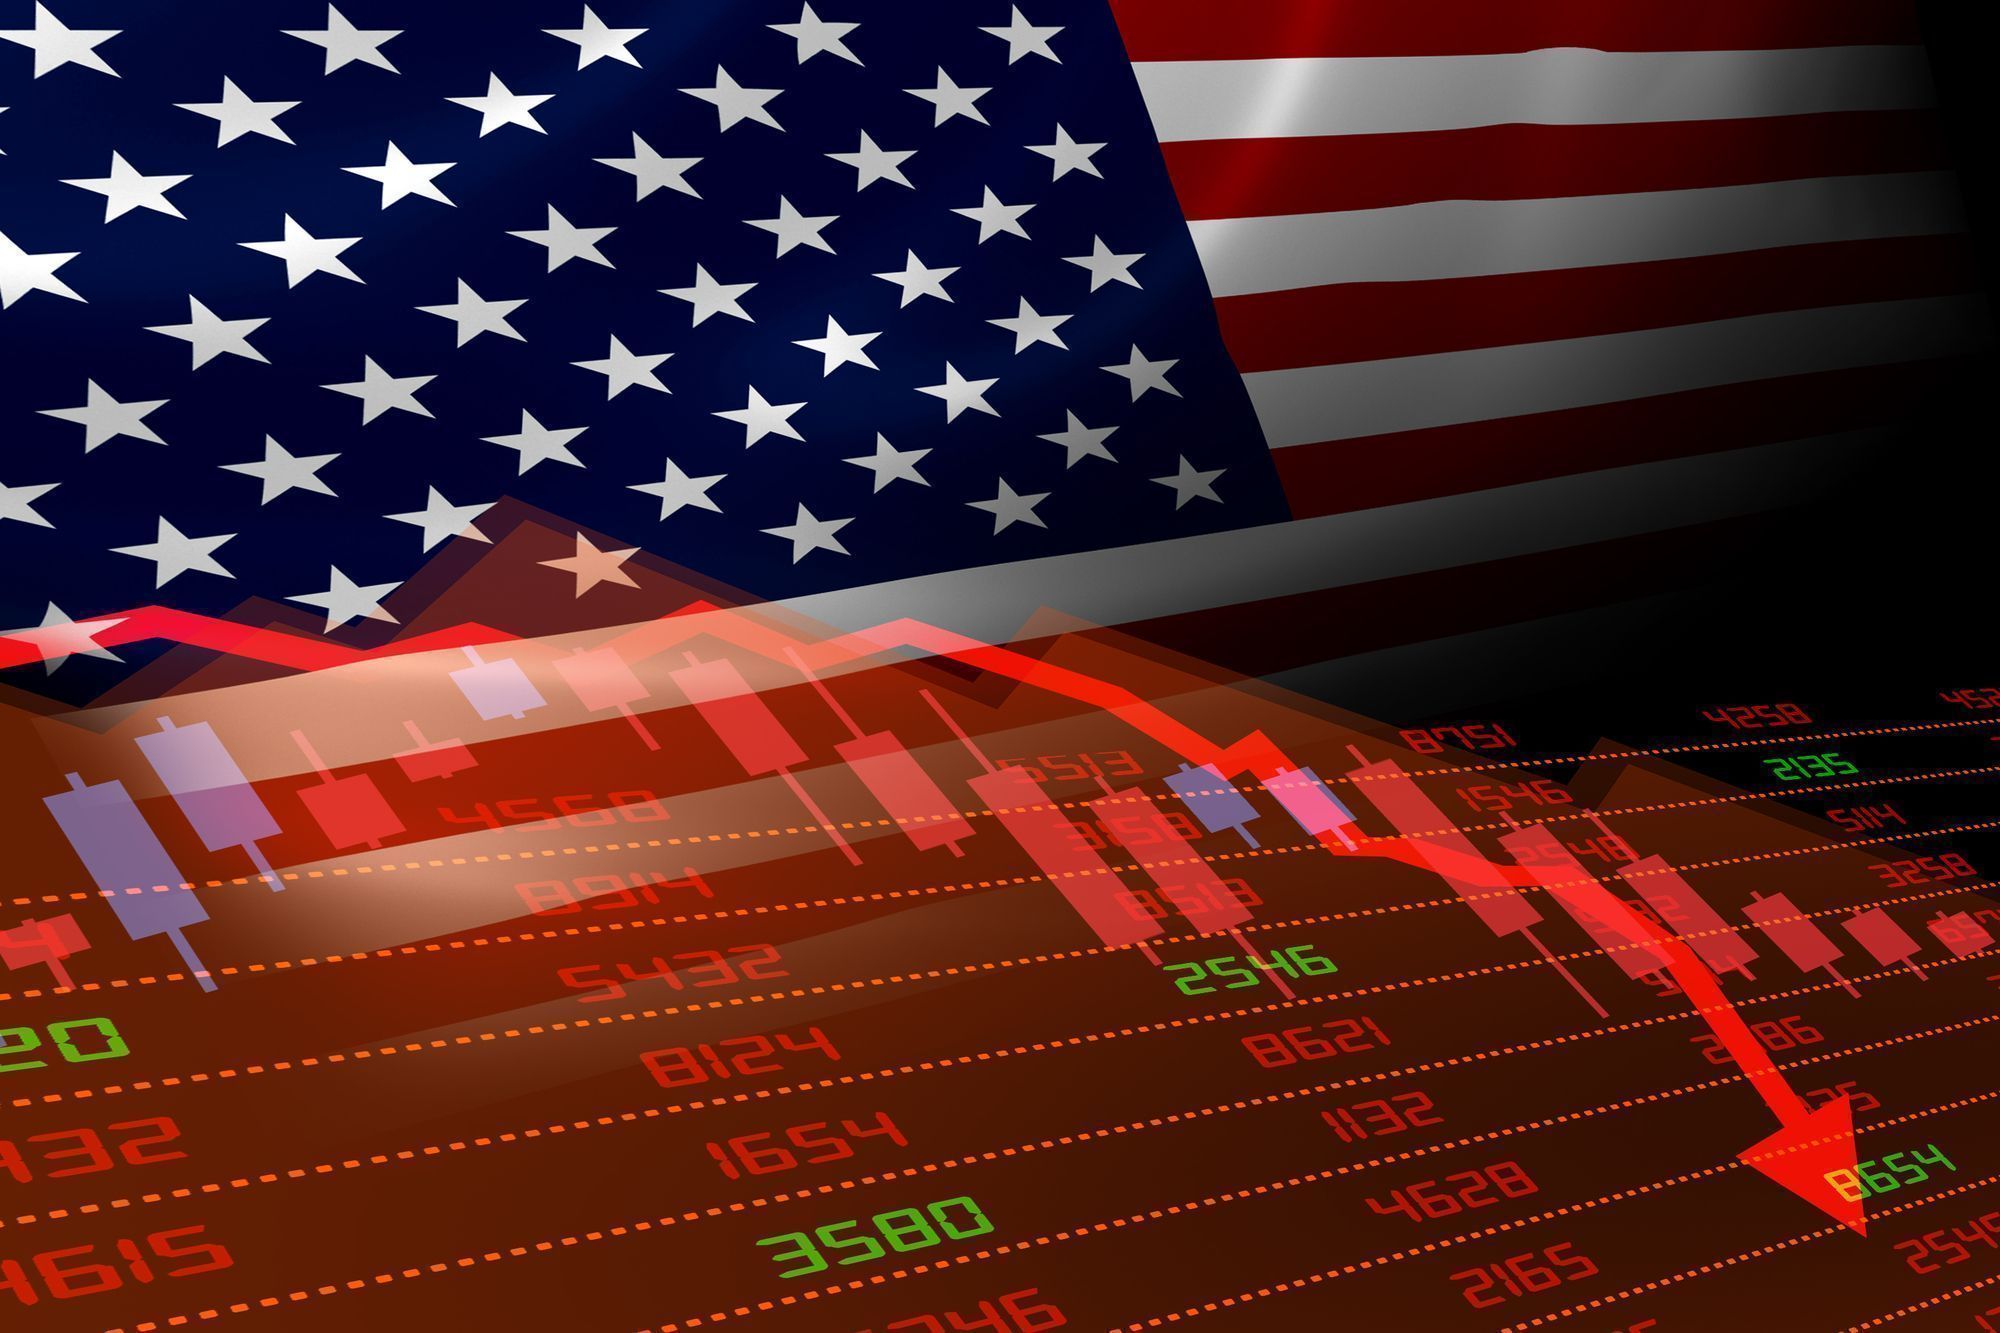
TradingKey - The uncertainty of Trump’s tariff policies is disrupting global markets, making already volatile markets even more unpredictable. This paper analyses multi-assets, sectors, and individual stock strategies to identify reliable investment opportunities in an uncertain political environment.
Executive Summary
Asset Allocation: We analyse four scenarios, ranked by likelihood. Scenario 1 assumes tariffs slow growth without a crisis. Supported by rate cuts and fiscal stimulus, this scenario favours U.S., Eurozone, and Japanese equities. Scenario 2 envisions a tariff-driven global recession, with significant rate cuts, favouring short-term U.S., German, French, and Spanish bonds. Scenario 3 expects stagflation, boosting gold prices. Scenario 4 assumes Trump reverses tariffs, lifting global equities (US, European, Japanese) to new highs. Given Scenario 1’s high probability, we are bullish on equities in the short term (0-3 months).
Sector Strategies: To analyse the impact of tariff policies, we find that in the short term, the discretionary consumption and industrial sector are hit bad; in the long run, different sectors face diverse situations, such as hard tech with localization opportunities and industrial goods with high restructuring costs. In response, we propose three investment viewpoints: favouring low-volatility value over small-cap growth, bullish on essential consumption rather than discretionary, and anticipating a V-curve recovery for the AI tech stocks.
Equity Strategies: When it comes to individual stocks, certain industries constitute companies that can be either winners or losers from the tariffs depending on their business model, geographical exposure or sub-sector focus. Investors can take advantage of these discrepancies by undertaking an offensive strategy by being bullish on a company not affected by the tariffs and bearish on a company that is affected by the tariffs, allowing investors to benefit from both positions. In addition, they can take a more protective/hedging stance by being bullish on a company negatively affected by the tariffs and, at the same time, bullish on the company that will benefit from the tariffs.
Part I: Asset Allocation
Since the start of this year, Trump’s administration has imposed tariffs on Canada, Mexico, and China, followed by a global “reciprocal tariff” announcement on 2 April. The “reciprocal tariff” has been suspended for 90 days for most countries since 9 April. However, the US-China trade war has experienced a tumultuous progression. In terms of imported goods, Trump has imposed tariffs on pharmaceuticals and films but exempted electronics and autos. This policy unpredictability has disrupted global markets. We believe single-outcome predictions are unreliable and instead explore asset allocation through four scenarios (Figure 1).
Figure 1: Four Scenarios
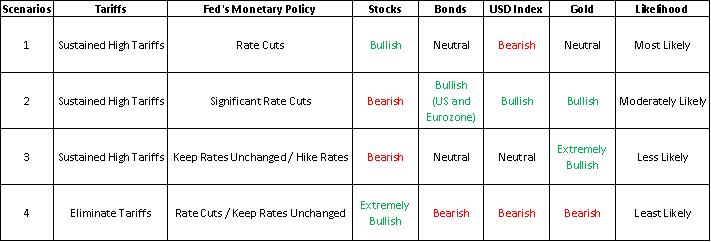
Source: TradingKey
Scenario 1 (Sustained High Tariffs + Rate Cuts)
In Scenario 1, we are bullish on equities. US tariffs and retaliatory measures from trade partners are expected to slow US economic growth but avoid a recession. While tariffs raise supply-side prices, weakening economic prospects and soft domestic demand curb inflation’s rebound. Short-term inflation may fluctuate, but the trend toward the 2% target remains intact. In this “low growth, low inflation” environment, we expect the Federal Reserve to resume rate cuts in June or July.
Slower growth weighs on US equities, but rate cuts provide a tailwind. Since 1995, during three preventive rate-cut cycles (unlike relief cuts), liquidity boosts from lower rates outweighed growth slowdowns, driving equity gains (Figure 2). Scenario 1 assumes a slowdown without recession, fitting a preventive rate-cut profile. On the fiscal side, pre-Global Financial Crisis (GFC) US policy prioritised the economy over markets. However, the GFC—exacerbated by the failure to bail out Lehman Brothers—taught a costly lesson. Subsequent interventions, like the 2008 Troubled Asset Relief Program (TARP) and the 2020 Coronavirus Aid, Relief, and Economic Security (CARES) Act, reflect a shift toward market-supportive fiscal measures. If US stocks plummet again, new legislation could act as a “government put”, bolstering markets. Thus, preventive rate cuts and fiscal backstops support our bullish stance on US equities.
In Europe, the Eurostoxx 50 index fell from a 19 March peak of 5,507 to a low of 4,622 before rebounding. Looking ahead, weak growth and falling inflation will prompt further ECB rate cuts, ushering in a low-rate environment in the Eurozone by late 2025. Historically, the last low-rate period began in November 2011 (the start of the Eurozone debt crisis), sparking years of equity market gains (Figure 3). This was driven by foreign capital inflows and low borrowing costs spurring private-sector equity investment. Unlike 2011, when fiscal constraints limited stimulus, the current cycle will align with Europe’s “rearmament” initiatives and Germany’s “whatever it takes” stimulus, stabilising growth via fiscal policy. Therefore, despite tariff risks, monetary easing, fiscal support, capital inflows, private-sector investment growth, and a potential Russia-Ukraine ceasefire, they underpin our bullish outlook on European equities. With around 60% of European stock index revenues from outside the Eurozone, stock selection is critical. Given short-term euro appreciation expectations, investors should prioritise European firms with significant domestic exposure.
For Japanese equities, tariffs will pressure growth and markets, but recent price declines may have priced in these risks. Once negative catalysts are exhausted, the upside is likely. Japan’s modest trade surplus with the US and smaller tariff exposure limit the tariff impact on Japanese stocks, supporting our optimistic view.
Figure 2: S&P 500 return during rate cut cycles
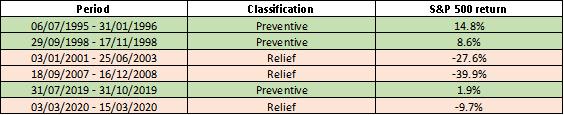
Source: Refinitiv, TradingKey
Figure 3: Eurostoxx 50 during the low-interest rate period since late 2011
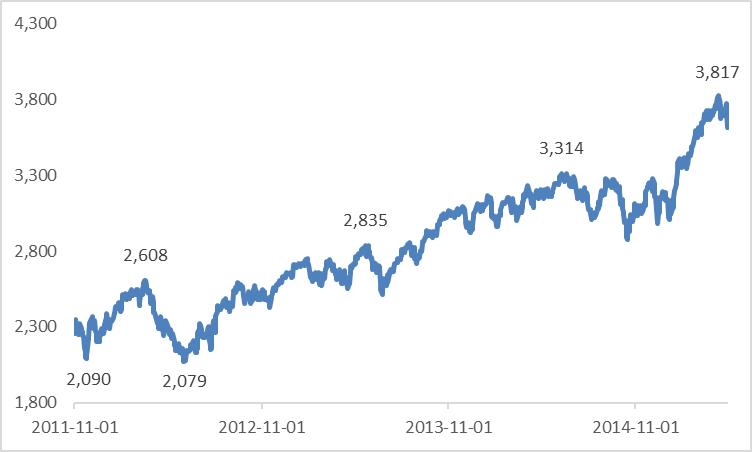
Source: Refinitiv, TradingKey
Scenario 2 (Sustained High Tariffs + Significant Rate Cuts)
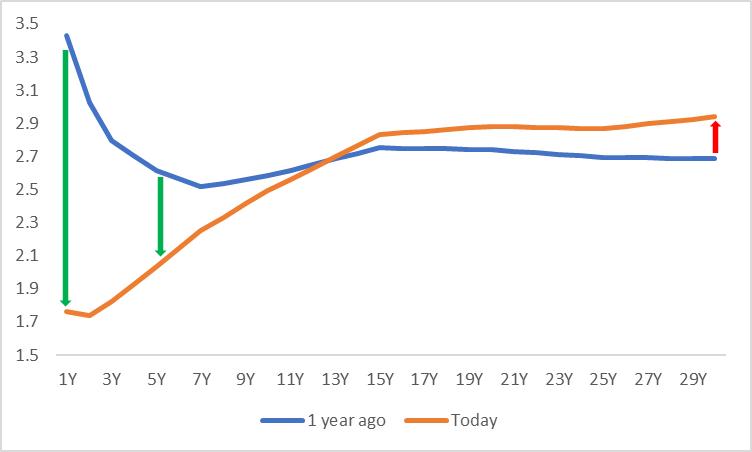
In Scenario 2, we favour US, German, French, and Spanish government bonds. Escalating tariffs and retaliatory measures could push the US and global economy into recession, prompting aggressive rate cuts by the Fed and ECB. This would lower yields and boost bond prices for US Treasuries and German bonds. Short-term bonds are preferred, as policy rate cuts drive short-end yield declines, while fiscal expansion to counter economic weakness caps long-end yield drops, steepening the yield curve (Figures 4 and 5). Among countries, French and Spanish bond yields will decline alongside German bonds, but Germany’s stronger safe-haven status in crises suggests milder yield drops for French and Spanish bonds, with smaller price gains.
It is worth noting that US Treasuries have long been a safe-haven asset, but recent price declines—driven by tariff uncertainty, Fed independence concerns, and narrowing growth gaps with other developed markets—have led some economists to question their status. However, we believe that, given the immense scale of the U.S. economy, the high liquidity and low transaction costs of the U.S. Treasury market, and the enduring confidence of global investors, the foundation of U.S. Treasuries as a safe-haven asset remains robust. Consequently, a fundamental shift to a risk asset is unlikely in the near term. Should a crisis emerge and the Federal Reserve implement significant interest rate cuts, U.S. Treasury prices are likely to resume their upward trajectory.
For Japanese bonds, aggressive global rate cuts may temporarily delay Bank of Japan (BoJ) rate hikes, but the BoJ’s ongoing tightening cycle makes yield declines unlikely. We are neutral on Japanese bonds.
Figure 4: U.S. Treasury Yield Curve (%)

Source: Refinitiv, TradingKey
* The Yield Curve is a curve that illustrates the relationship between bond yields and their maturities, commonly used to analyse interest rate levels across different bond terms. The horizontal axis represents the remaining maturity of bonds (e.g., 1 year, 10 years, 30 years), while the vertical axis shows the bond yields. Generally, if the curve's movement is driven by central bank policy rates, short-term (front-end) yields exhibit larger changes. Conversely, if driven by economic fundamentals, long-term (back-end) yields experience greater fluctuations.
Figure 5: German Government Bond Yield Curve (%)
Source: Refinitiv, TradingKey
Scenario 3 (Sustained High Tariffs + Keep Rates Unchanged / Hike Rates)
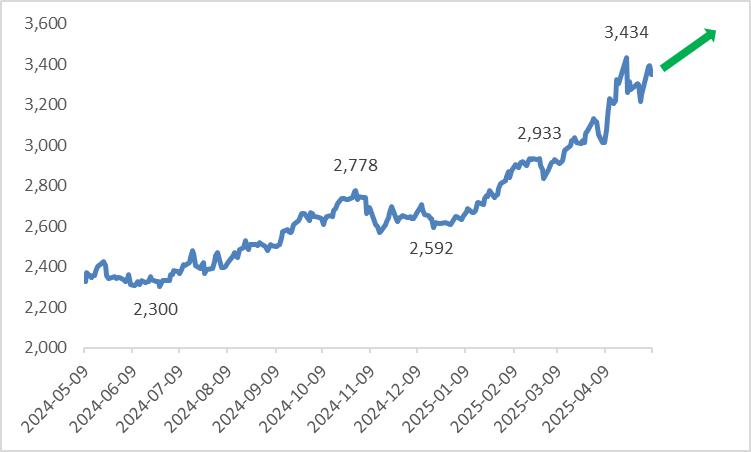
In Scenario 3, gold prices are expected to continue rising. Here, tariffs not only slow growth but also fuel inflation, creating stagflation. Low growth highlights gold’s safe-haven appeal, and high inflation underscores its store-of-value properties. Additionally, tariffs raise import prices, effectively devaluing the US dollar relative to goods, boosting gold’s dollar-denominated price. Retaliatory measures could similarly weaken other currencies, further supporting gold (Figure 6).
Figure 6: Gold Prices (USD/oz)
Source: Refinitiv, TradingKey
Scenario 4 (Eliminate Tariffs + Rate Cuts / Keep Rates Unchanged)
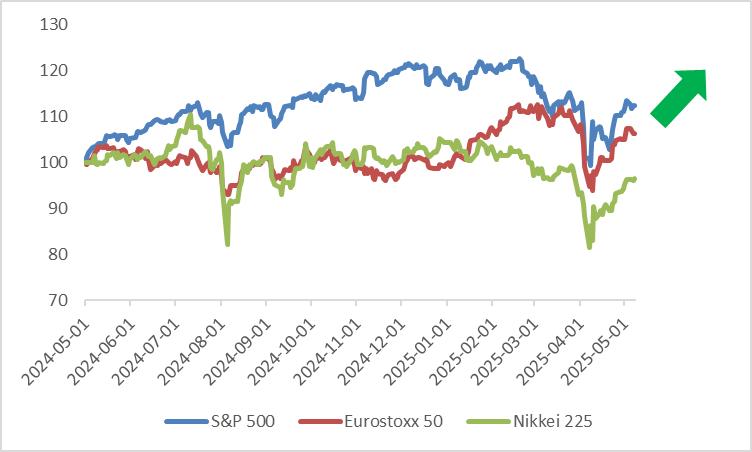
Scenario 4 assumes that under intense pressure from the American public and Congress, Trump is forced to withdraw all or most tariff policies, ending the trade war. Although this scenario is the least likely, recent signs of easing U.S.-China trade tensions suggest its probability is increasing. Should this scenario materialize, major global stock markets (including the U.S., Europe, and Japan) are likely to reach new highs in the near term (Figure 7).
Figure 7: Stock Indices (Rebase 1/5/2024 = 100)
Source: Refinitiv, TradingKey
Part II: Sector Strategies
Under the Trump administration's comprehensive implementation of the "reciprocal tariff" policy, the average effective tariff rate on imported goods in the United States has surged. Coupled with retaliatory measures from major trading partners like China and the European Union, the reconstruction of global supply chain costs and market seg-mentation have become reality. In our previous analysis, we projected that the impact of the reciprocal tariff policy on U.S. growth and inflation would be continuous. The counter-globalization trade pattern and the multi-lateral geopolitical game situation will impact U.S. listed companies through both import and export sides.
Imports: Soaring Supply Chain Costs, with Manufacturing Hit First
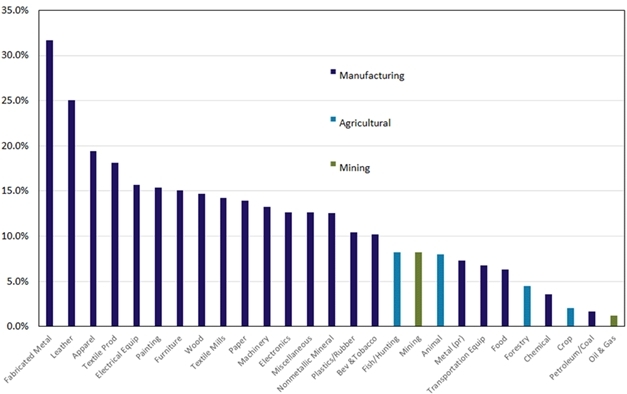
The comprehensive tariff package introduced has a varied impact on specific industries, causing the average effective tariff rate (AETR) to climb from 7.1% to 10.4%. However, the tariffs faced by different industries are totally different. Overall, these tariff approach will concentrate costs on key parts of the U.S. manufacturing base, especially intermediate products and finished goods that rely on complex cross-border supply chains.
Chart: The Imports Tariff Rate of US by industries
Source: Census Bureau international trade data
Among them, the industry that is hit hardest is manufacturing. For example, metal products are caught in both steel and aluminum tariff measures, thus facing the highest average tariff rate (over 30%). The apparel and textile sectors also see a sharp increase, reflecting their dependence on imports from China and USMCA partners. In contrast, energy and agriculture-related goods such as crops and forestry have much lower average tariffs. This is consistent with their more limited exposure to targeted trade flows or exemption protections.
Exports: Retaliatory and Market Diversification Measures
As the policy focus shifts to retaliatory export tariffs, the situation in China, the European Union, Mexico, and Canada shows that the manufacturing sector has the highest proportion of industries facing "more significant risks." Given that the situation with Mexico and Canada may lead to more exemptions under USMCA, the focus should be on industries with substantial imports and cost exposure to China. The following chart provides a deeper look at U.S. imports from three countries. Overall, the affected sectors are mainly discretionary consumer goods, technology hardware, and some transportation equipment. Specifically, for China, it's mainly discretionary consumption and technology hardware, while equipment and machinery exports mainly head to Canada and Mexico.
Chart: The Exports Tariff Exposure of US by industries
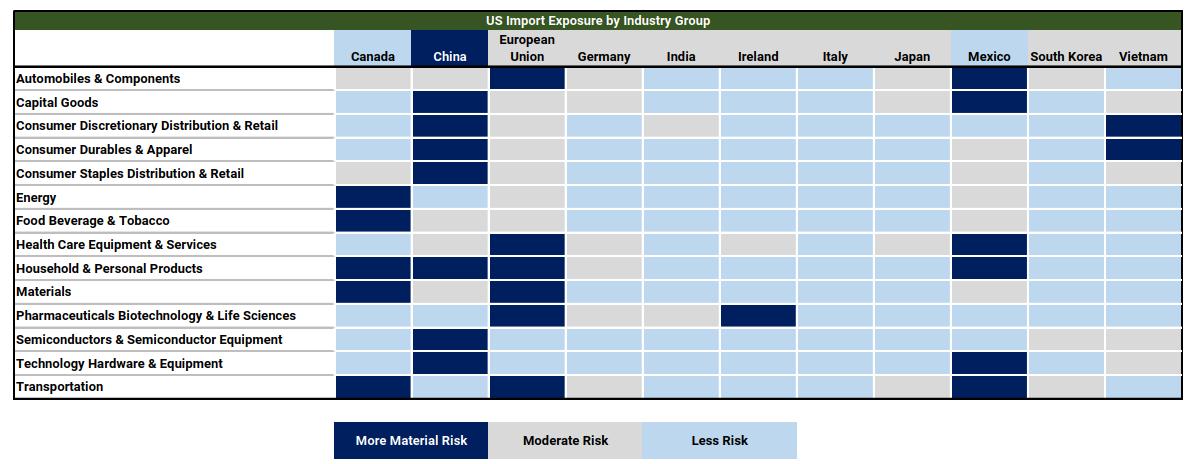
Source: AlphaWise Web Intelligence, UN Comtrade, Morgan Stanley Research.
Here we are considering the short-term impact of both import and export tariffs on the industry level, the average EBIT of essential consumer goods (especially household items) and the healthcare sector is less affected by tariffs, showing strong resilience. In contrast, discretionary consumption (apparel retail, auto parts) and industry (electrical equipment) are hit the hardest. To cope with the short-term tariff policy shock, we should prioritize industries with a median EBIT impact from tariffs below 5% (essential consumption, some tech sectors) and avoid industries with significant EBIT impact (discretionary consumption, some industrial goods).
Chart: The Average Tariff Impact as Percentage of EBIT among Industries
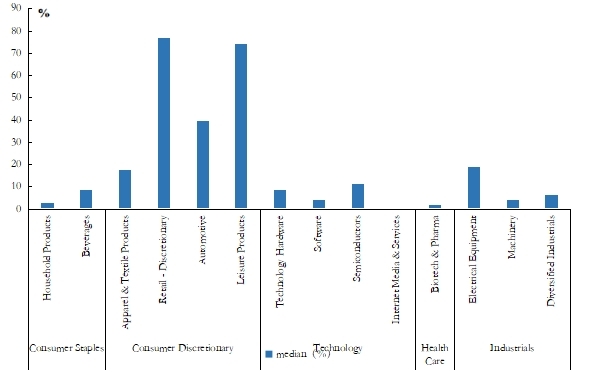
Source: Bloomberg.
How U.S. Policies Are Rocking Industry Boats in Long Term
Taking a longer-term view, the "asymmetric shock" of U.S. tariff policies has penetrated from the macro trade level to the industrial chain. Its impact would differentiate from the above EBIT impact. Below, we comprehensively consider the most affected in supply chain and price elasticity dimension, thus we conduct a strategic analysis of the four main industry categories in the chart above.
1)Hard Tech: Policy-Driven Localization Opportunity
In short term The U.S. tariff exemptions under the Harmonized Tariff Schedule (HTS) remain narrowly focused, which would indirectly harm the EBIT of Technology firms. However, in the long term, the $52 billion CHIPS Act has accelerated high-end manufacturing reshoring, evidenced by a 48.4% surge in semiconductor sales in US. The AI tech companies are leveraging localized production, driving regional restructuring opportunities in future.
2)Industrial Goods: Restructuring Costs Is Huge
In short term, industries reliant on global supply chains (such as automotive) face tariff-induced low EBIT pressures. Compliance with USMCA origin rules allows Mexican sup-pliers to bypass tariffs, incentivizing regionalized production shifts. It still takes a long time and high cost for the new round of industry reshuffling.
3)Commodities:Self-Harm Effect Leads to High Cost
In short term, tariffs amplify global recession risks, leading to inventory buildup and high price volatility. While in the long term, tariffs reduced imports would cause domes-tic costs get even higher, industrial firms would navigate a fragile situation of overcapacity.
4)Consumer Goods: Cost Pass-Through and Substitution
U.S. tariffs targeting trade deficit hubs like Vietnam (34% of footwear imports) and Chi-na drive supply chain diversification. In the long term, producers are seeking regions in the Americas and Southeast Asia with lower supply chain risks. Consumers adapt through "downgraded consumption" by brand substitution and quality Trade-offs.
In summary, the U.S. reciprocal tariff policy has reshaped supply chain and cost pass-through. The essence of the policy is a structural game driven by trade protectionism to promote industrial return and prioritize strategic industry security. Specifically, the im-pact of reciprocal tariffs on U.S. stocks in various industries can be referenced in the table below.
Industry | Tariff Impact |
Semiconductors & AI Chips | Exemption scope only covers some advanced chips, GPUs, servers, and equipment still face a 10% tariff impact, leading to increased supply chain costs |
Automotive & New Energy | Increased supply chain costs in the US-Mexico-Canada region (vehicle cost +10%), but exemption of some parts tariffs accelerates domestic production substitution |
Energy & Industrial Metals | Shale oil production increase offsets import dependence, LNG exports are hindered; aluminum industry supply chain shift raises costs by 25% |
Agriculture & Pharmaceuticals | Soybean/corn exports shrink, forcing domestic alternatives and subsidies; pharmaceutical raw material import costs rise |
Retail & Consumer Goods | Companies relying on the Vietnamese supply chain face a sharp cost increase (apparel/shoe tariffs reach over 40%), while domestic demand brands show resilience |
Power Equipment & PV | Tariffs on Chinese PV modules reach nearly 50%, forcing domestic clean energy production and investment |
Biopharmaceuticals | Drug raw materials are exempted, but medical device taxes are increased, accelerating domestic R&D of innovative drugs |
Industrial Machinery | Infrastructure stimulus policies boost demand, but import tariffs on parts push up costs |
Consumer Electronics | Terminal price increases suppress demand, while leading companies reduce impact through overseas capacity shifts |
Source: Tradinkey
Under the shadow of the Trump administration's reciprocal tariff policy, the reconstruction of the global supply chain, the surge in corporate costs, and the intensification of market volatility have become a reality. The short-term fluctuations in U.S. stocks and industry differentiation force investors to re-evaluate their risk exposure. Historical experience shows that the escalation of trade barriers often gives rise to structural opportunities such as policy arbitrage and supply chain restructuring. Next, we will start with the tariff impact on industrial adjustments and explore three strategic views that can adapt to a highly volatile market.
Viewpoint 1: Bullish on Low-Volatility Value, Bearish on Small-Cap Growth Style
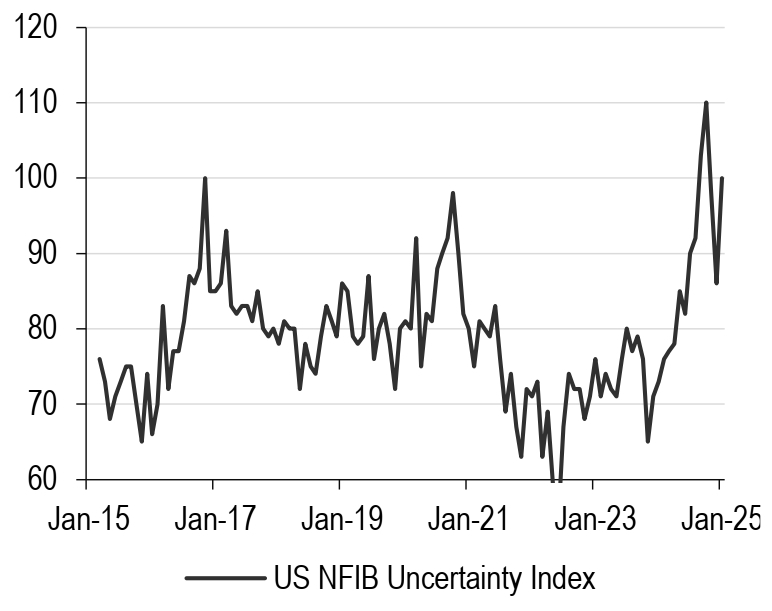
The ever-changing trade policies of the Trump administration have caused high volatility into the global market. A three-month suspension of tariffs on countries other than China, coupled with bilateral negotiation processes, means that U.S. markets will face high policy uncertainty before 25Q3, which implies that the US stock market will continue to face high volatility. Thus investors would prefer to increase their allocation to industries immune to tariffs, as well as individual stocks with low volatility and the characteristics of a "safe haven." Here we prefer to avoid small-cap growth styles (such as the Russell 2000 Index) that have high beta, high volatility premiums, rely heavily on cross-border supply chains, and lack bargaining power.
Source:LSEG, Tradingkey
Looking at the 2025 Q1 earnings outlook, low-volatility value stocks' profitability is on a sustained upward trend and is close to historical valuations. In contrast, small-cap indices (like Russell 2000) have higher valuations and weaker profitability. Specifically, low-volatility value stocks mainly include essential consumer goods, financials, and utilities sectors. 78% of the companies in this category have achieved supply chain localization. In the small-cap style, over 35% are highly dependent on cross-border supply chains, the revenue impact can be over 10%.
Dimension | Low-Volatility Index (USMV) | Small-Cap Growth Index (IWM) |
Forward PE | 20.1x (historical average 19x) | 33.5x (historical average 25x) |
Dividend Yield | 3.2% vs. S&P 500's 1.6% | 0.4% (78% of constituents unprofitable) |
Beta Coefficient | 0.82 | 1.35 |
Tariff Impact | Revenue impact < 3% | Revenue impact > 12% |
Earnings Revision Momentum | Future 12-month EPS up 2.1% | EPS down 4.7% |
Source:LSEG, IBES, Tradingkey
During tariff negotiation windows, global concerns about the resurgence of trade protec-tionism often intensify. For capital preservation reasons, funds shift from high-beta assets to low-volatility assets and from globally oriented high-growth companies to localized sup-ply chain assets. The pandemic shocks show that before uncertainties are eliminated, low-volatility value styles significantly outperform small-cap growth.
Viewpoint 2: Bullish on Essential Consumption, Bearish on Discretionary Consumption
The current U.S. economic growth is slowing down, but inflationary pressures remain under the tariff impact. Looking at the sub-item growth rates of the U.S. CPI, essential consumption becomes more rigid, while the YoY growth rate of durable goods CPI is still negative. Among them, discretionary consumption expenditures such as home appliances and automobiles are more sensitive to interest rates, and discretionary consumption demand can be delayed and reduced. In tariff shocks, U.S. personal savings passively increase, and the pressure of consumption downgrading also favors the dominance of essential consumer goods.
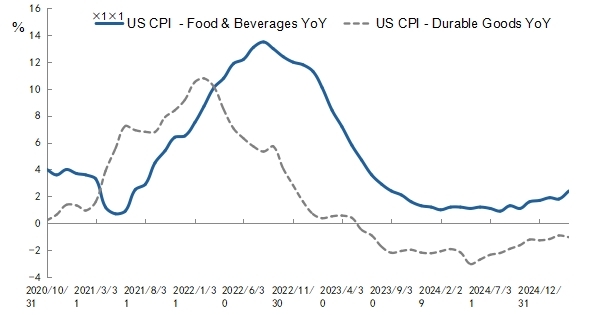
Source:LSEG, Tradingkey
The U.S. imposition of tariffs has a misaligned impact on essential and discretionary consumption sectors. Among staple companies, 78% of them could localize their supply chains (such as P&G, Coca-Cola, etc.), but over 35% of discretionary consumption producers have a high dependence on imports and overseas supply chains and weak pricing power downstream. The ROE of essential consumption (21.3%) is significantly higher than that of discretionary consumption (14.7%), reflecting its stronger profitability stability and less impact on the demand side from economic downturns. Even if inflation is high or tariffs push up costs, consumers cannot cut daily budgets. However, discretionary consumption faces increased inventory pressure for high-end products and is forced to cut prices. Additionally, the low-volatility attribute mentioned in Viewpoint One will attract more risk-averse funds to hold essential consumer goods, which have a significant low-beta advantage.
Sector | Essential Consumption (XLP) | Discretionary Consumption (XLY) |
ROE (TTM) | 21.30% | 14.70% |
Inventory Turnover Days | 58 days | 112 days |
Tariff Sensitivity | Revenue impact < 3% | Revenue impact > 12% |
Beta Coefficient | 0.82 | 1.35 |
Impact of Consumption Downgrading | Increase in low-price product lines | Accumulation of high-end product inventory |
Source: Tradinkey
In the current macroeconomic slowdown, U.S. active common funds began to shift to de-fensive positions in Q1, concentrating on adding underweight consumer staples sectors (such as retail, food and beverages, and daily necessities) and avoiding discretionary con-sumption sectors (such as durables and apparel). The shift into essential consumer goods stocks was the largest single-quarter portfolio rotation since March 2020. Considering that the U.S. will still face inflation and the pressure of consumption downgrading in the next half year, the trend of staples' dominance may continue until the Fed Rate Cuts.
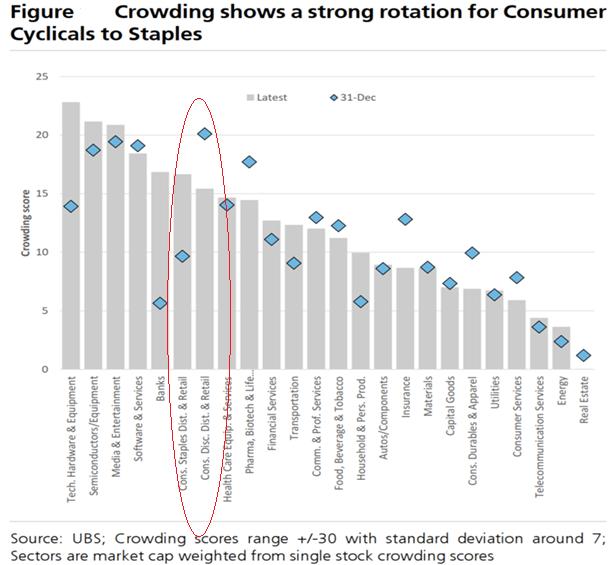
Source:UBS, Tradingkey
Viewpoint 3: Making AI Tech Great Again: The V-Curve Recovery
Under the reciprocal tariffs, the U.S. manufacturing sector get hit the hardest. U.S. textile, apparel, and luxury goods companies source 87% of their goods from abroad—nearly half from China alone. These companies will face risks of compressed profit margins and declining orders, and in the medium to long term, they will also face challenges in supply chain restructuring.
In the recent sell-off, AI-related U.S. stocks get hit hard, with PE valuation returning to near the five-year average (26x). This is mainly due to the impact of the global integrated hard-ware supply chain, but U.S. export controls and trade protection measures mean that the technology and service sectors, which have a high proportion of overseas revenue and strong tariff immunity, can still enjoy the benefits of U.S. fiscal and monetary easing policies. They are expected to become a truly beneficiary sector in the face of tariff policy disruptions.
Chart: The valuation of large-cap tech stocks has returned to the historical average.
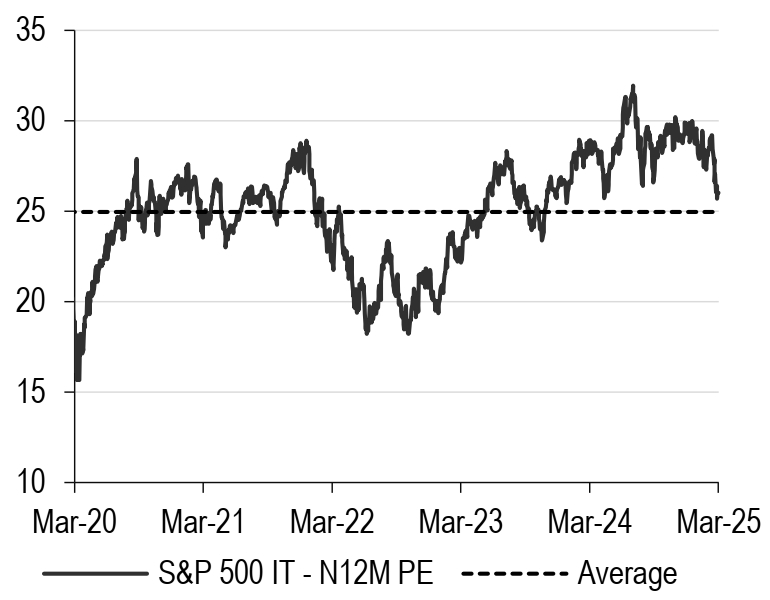
Source:HSBC, Tradingkey
In 2025, the top four spending companies in the U.S.(Amazon, Microsoft, Google, and Meta) plan to deploy over $300 billion in capital expenditures, far exceeding any other single industry, with most of it planned for expanding AI infrastructure. Even if the pace of capital expenditure slows slightly amid trade tensions or macroeconomic uncertainty, this wave of capital expenditure is still the strongest in terms of global growth. In the medium to long term, he United States' structural artificial intelligence advantage, combined with its resilience to potential tariffs, makes related tech stocks to enjoy a profit margin boost.
Chart: 2024 U.S. industry capital expenditure
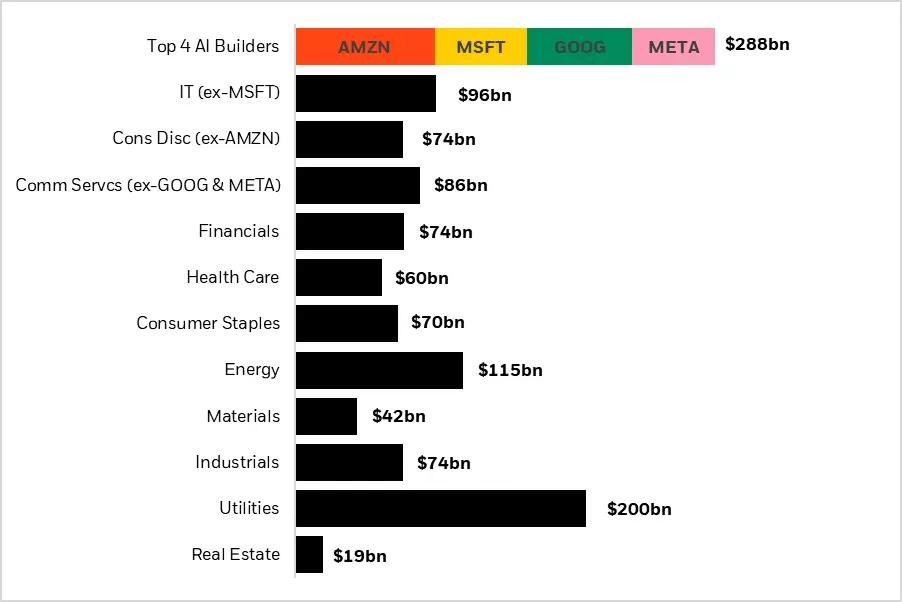
Source:Refinitiv, Black Rock
Statistics on the performance of U.S. stocks during the five interest rate cut cycles since 1989 show that because interest rate cut cycles are often accompanied by expectations of economic slowdown, defensive industries (such as essential consumer goods and healthcare) still have resilience, but growth industries (such as tech stocks) are more favored due to their long-term growth potential. Tech stocks' EPS growth rate during interest rate cut cycles is on average 8.2% higher than during interest rate hike cycles, and the forward PE expands from 28 times before the rate cut to 32 times, while the PE of value stocks only rises from 15 times to 16 times. As we can see from the graph below, SPX Small and Growth performed much better than Russell 2000, which has higher cyclical exposure to industrials.
Chart: Performance of major U.S. indices during interest rate cut cycles since 1989
.jpg)
Source:Globla X
Based on the analysis above, this also provides us with a dual-line strategy inspiration for the start of this round of interest rate cuts in 2025: embracing the growth of tech stocks, but also not forgetting to retain the defensive attributes of essential consumer goods.
Part III: Equity Strategies
In the previous section, we looked into how the tariffs and the recent economic woes could impact various industries. However, in this section, we will gradually shift our focus to a more granular (individual stock) level.
“A Tale of Two Cities”
Not all stocks are created equal when it comes to tariffs. In fact, in many industries, the new trade policies create a very nuanced landscape with well-defined winners and losers. On one hand, some companies are highly exposed to tariffs, threatening their supply chains, revenue, profitability, competitive moat and market share. On the other hand, other companies are relatively insulated or even well-positioned to benefit from the global trade chaos.
Investors can take advantage of these discrepancies by utilizing one of the two following strategies based on their risk appetite:
1. Offensive Strategy: Bullish on a company not exposed to tariff risk and bearish on a company that is exposed to tariff risk. This strategy will enable investors to have a two-way benefit based on the recent tariff environment.
2. Defensive Strategy: Bullish on a company that can benefit from the tariffs and bullish on a company whose business will suffer from the tariffs. This strategy provides a hedge against the risks associated with the recent trade policies.
Offensive Strategy Example: CrowdStrike (CRWD) vs Palo Alto Networks (PANW)
CrowdStrike and Palo Alto are two of the largest pure play cybersecurity companies in the world. Even though they are industry peers, their respective business models differ from one another, which expose them to tariffs to a different degree.
CrowdStrike does not have much embedded tariff risk. The main focus of the company is endpoint and cloud security. The way CrowdStrike makes money is mostly from subscribing to their software products in exchange for a regular fee. The cloud-native nature of CrowdStrike enables them to quickly deploy their products in a cloud environment, without the need for an upfront installation of hardware devices in the clients’ premises.
Source: SEC Filings, TradingKey
The cost of revenue for CrowdStrike consists of no hardware-related costs such as server hosting, amortization, employee benefits and stock-based compensation. This implies a potential increase in tariffs will not significantly increase the cost of revenue, hence the low probability of a significant margin compression, potentially keeping the profit unaffected.
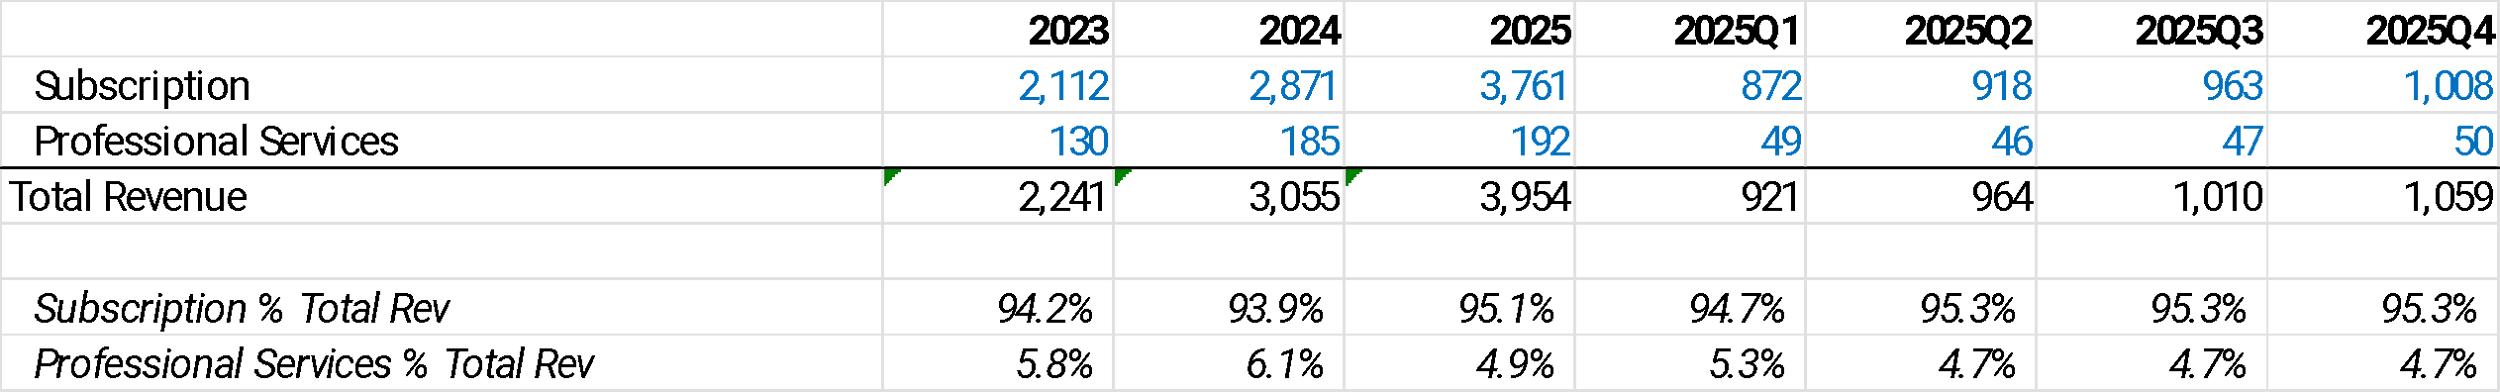
On the other hand, Palo Alto derives its revenue from both subscription and product. As of the latest quarter, the product revenue represents nearly 19% of the total revenue. The product revenue mostly represents the sales of hardware appliances, primarily the ML-Powered Next-Generation Firewall.
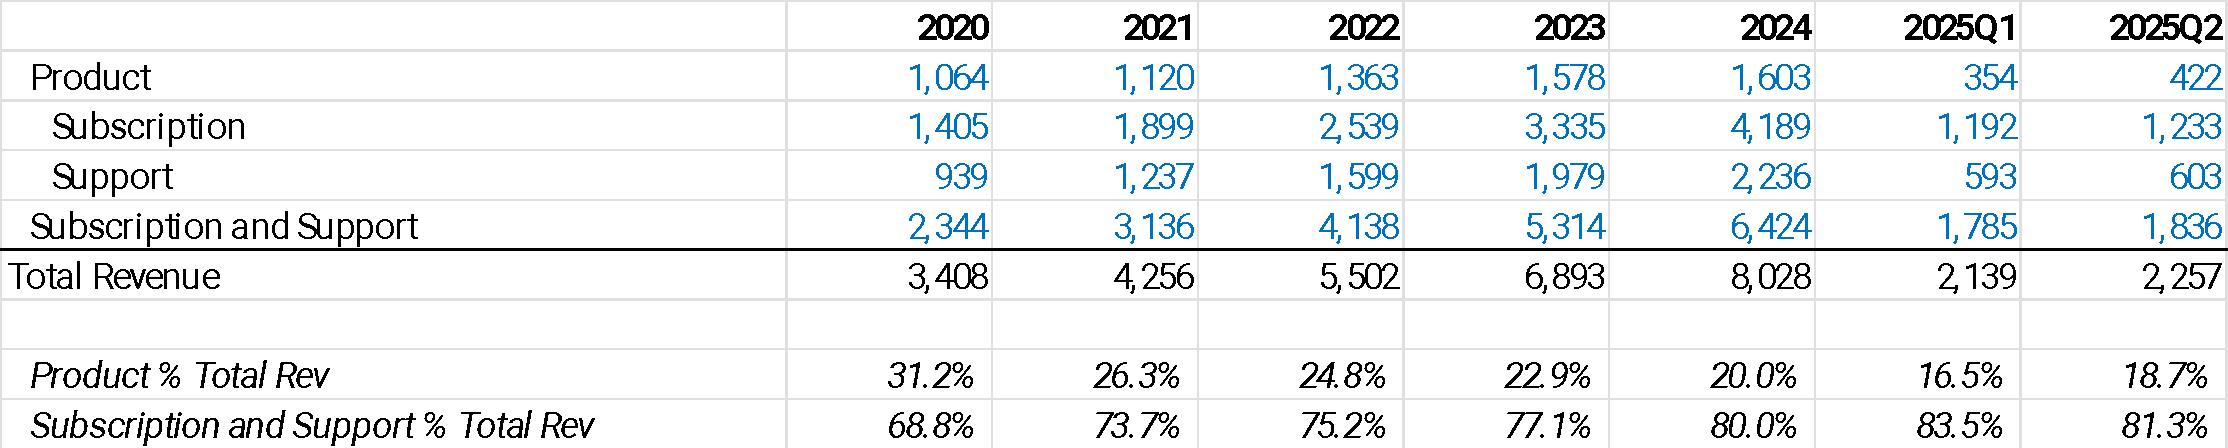
Source: SEC Filings, TradingKey
The product-related cost of revenue consists of costs associated with the manufacturing and assembling of these hardware devices. Palo Alto indicated it is the only security hardware vendor that assembles all of its products in the US but some of the components are sourced from China and this is where the major risk comes from.
The product-related cost of revenue represents roughly 4% of the total revenue and 17% of the total cost of revenue. Even though these numbers do not seem very big, the tariffs imposed on Chinese exports will be quite heavy and this will have a material impact on the cost of revenue for the company, therefore reducing the margin and negatively affecting the bottom line of the income statement. According to an estimate from Bloomberg, Palo Alto is expected to face a headwind of $209 million in their gross profit. In comparison, the total cost of revenue for 2024 was $2.1 billion.
The company continues to pursue a China substitution strategy, by restructuring its manufacturing footprint and transitioning to contract manufacturing. However, it is still not clear how long it will take for Palo Alto to rearrange its supply chain.
As our base case macroeconomic scenario suggests, we believe the US government will carry on with the tariffs thus giving investors a chance to take advantage of the CrowdStrike strength and Palo Alto weakness.
If we look at the price chart, both companies have been moving together rather consistently throughout the history. However, after the Trump’s election in November, CrowdStrike has been significantly outperforming Palo Alto.
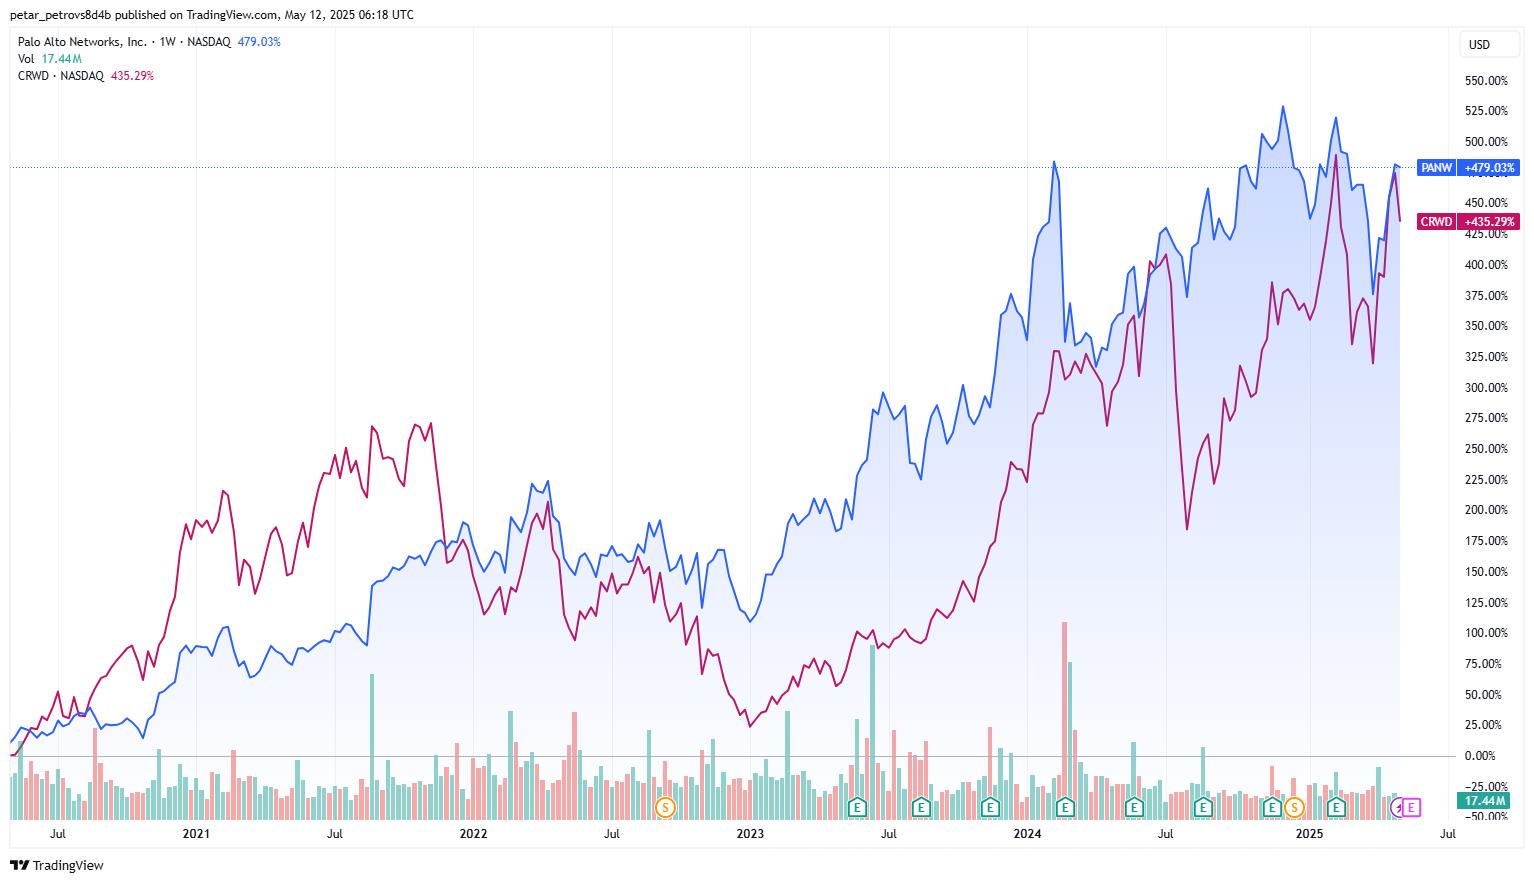
Source: TradingView
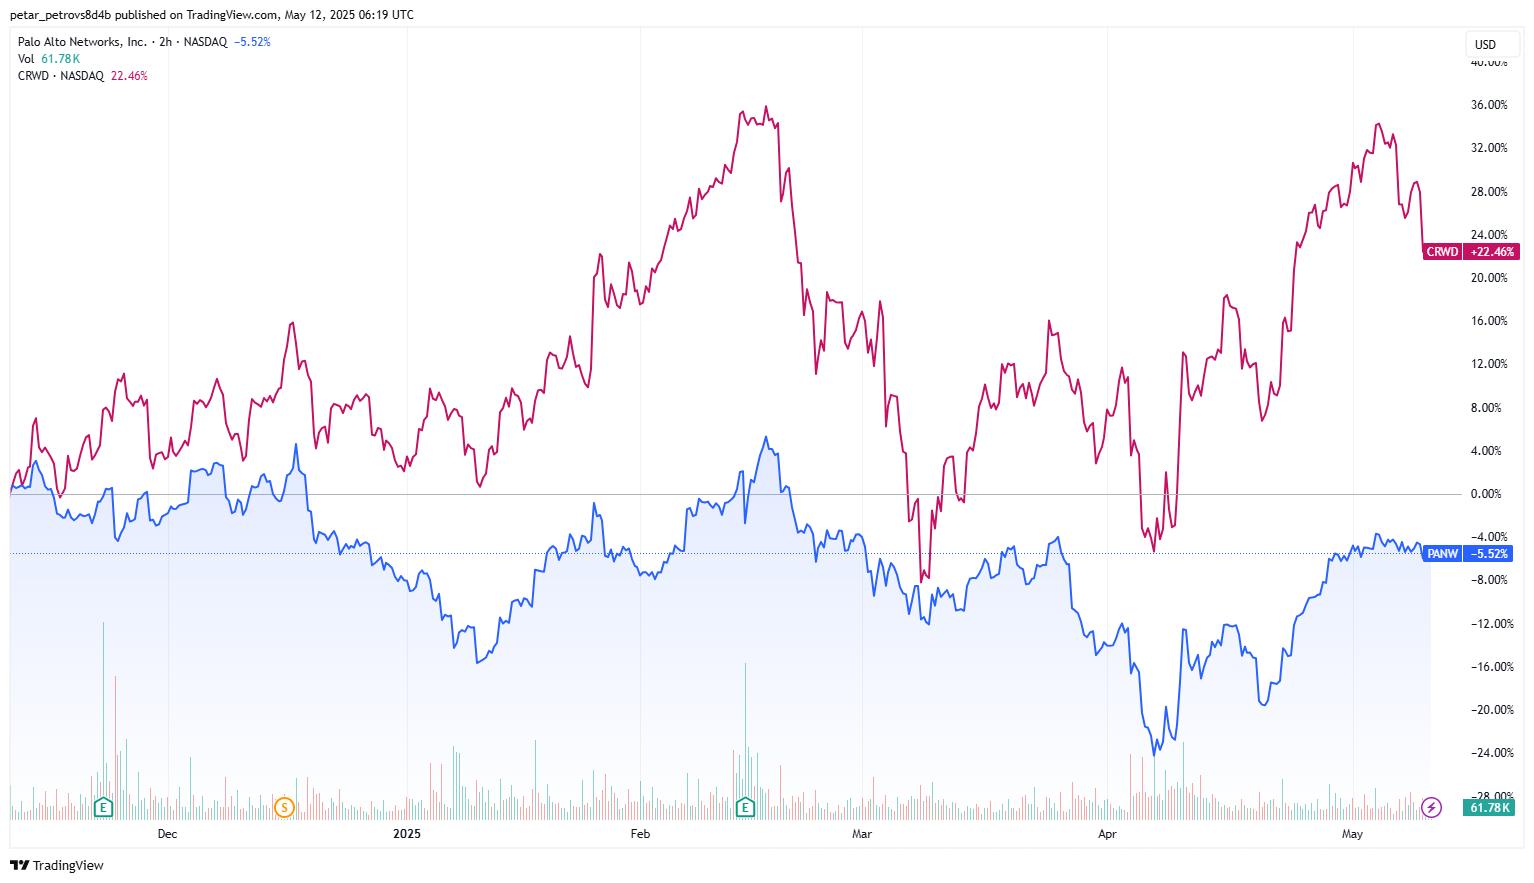
Source: TradingView
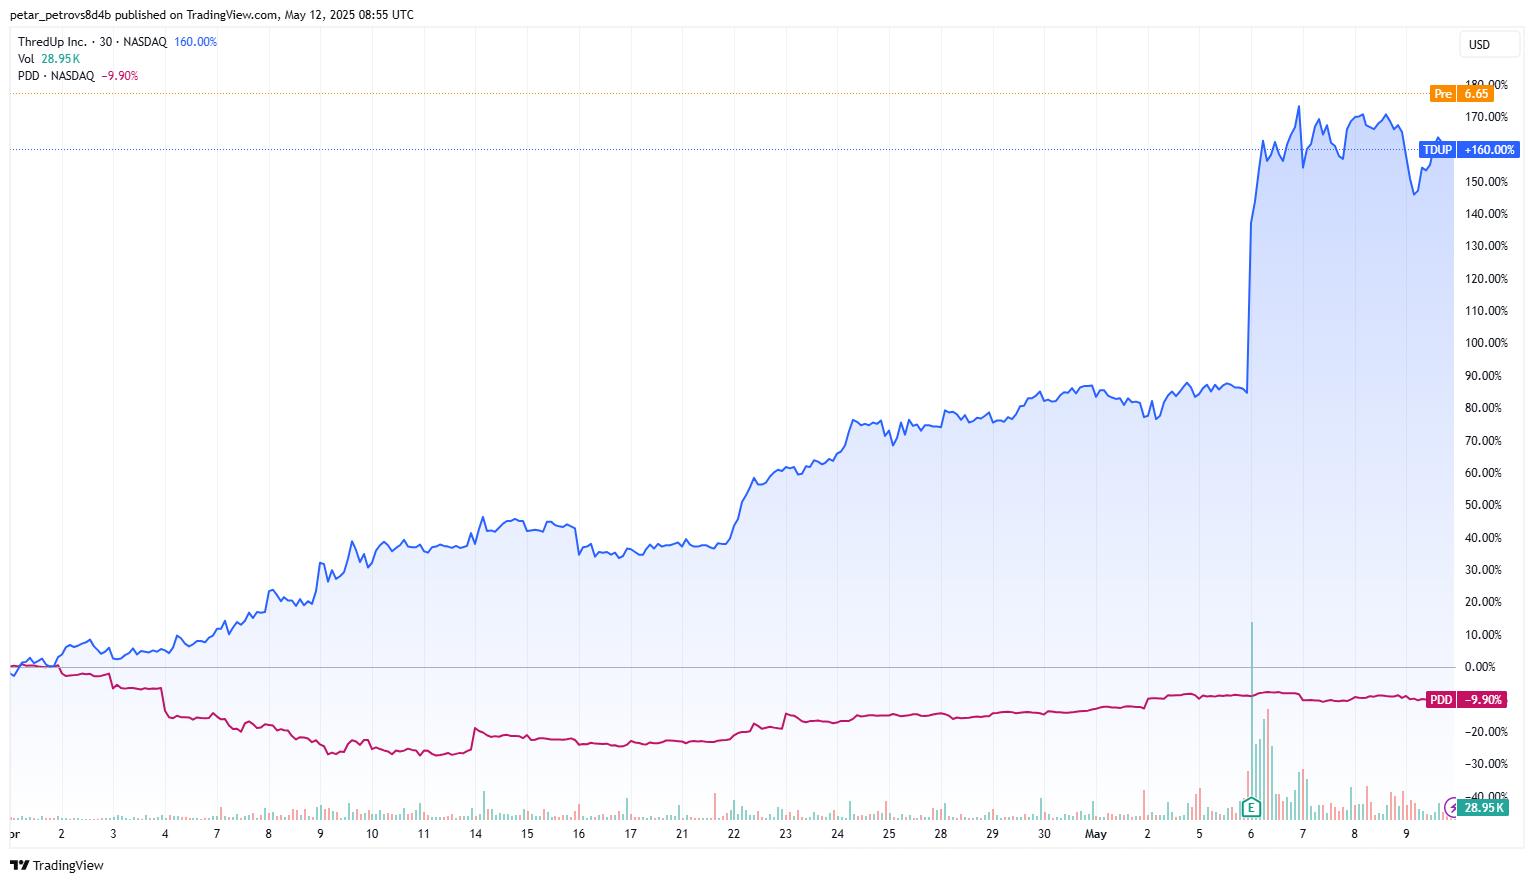
Defensive Strategy Example: Pinduoduo (PDD) vs ThredUp (TDUP)
E-commerce is an industry that is going to be dramatically impacted by the tariffs, especially when it comes to apparel shopping. Clothing retailers in America rely very heavily on supply chains in Asia. With cutting off the de minimis tariff loophole (allowing items worth $800 or less to enter the country duty-free), Pinduoduo and its international platform Temu will face a significant scale back in its US business.
Temu made a name for itself in the U.S. as a destination for ultra-discounted items shipped direct from China, it has been able to keep prices low due to the de minimis rule. Once the prices of the products sold on Temu become more comparable with the other e-commerce peers such as Amazon, the fast-growing platform will quickly lose steam, and the most recent data draws such exact picture.
The total number of downloads of the Temu app fell 73% in the last week of April compared to the final week of March. Weekly active users fell 43% over the same period, according to the analysts' estimates. Further to this, Temu has already scaled back its advertising campaigns in the states, as per what the big online advertisers Google and Meta have disclosed so far.
With all the major headwinds in the face of tariffs on apparel products, the de minimis rule and the economic slowdown, a surprising winner is emerging in the apparel e-commerce field and that is ThredUp Inc (TDUP).
ThredUp is an online resale platform that helps consumers buy and sell primarily secondhand apparel, shoes, and accessories. Its inventory includes well-known brands such as J.Crew, Ann Taylor, Banana Republic and Lululemon.
ThredUp is not affected by the tariffs as the secondhand clothes sold on its platform are sourced from within the country, because unlike firsthand retailers, resale shops do not need to import most of their merchandise. That means they can maintain more competitive prices than the apparel brands selling brand new items.
Additionally, the closure of the de minimis rule will make ThredUp more of an attractive alternative to platforms like Temu and Shein.

Source: Company Reports, Water Tower Research LLC
Last but not least, the secondhand cloth market is rather countercyclical. With the slowdown of the economy and the worsened spending, the consumers, becoming increasingly price-conscious, will turn more towards second-hand clothes.
For most players in the sector, tariffs and suppressed consumer spending are significant macro headwinds. However, in the case of ThredUp, the headwinds automatically become tailwinds. ThredUp saw 95% growth in new shoppers, partly attributed to tariff-driven shifts toward secondhand markets. Also, the number of orders in the last quarter increased 20% year-over-year.
When it comes to historical price movements for the two stocks, Pinduoduo is a clear winner. However, since the announcement of the tariffs in early April, the Chinese e-commerce giant is down 10%, while ThredUp stock went up with the incredible 160%.
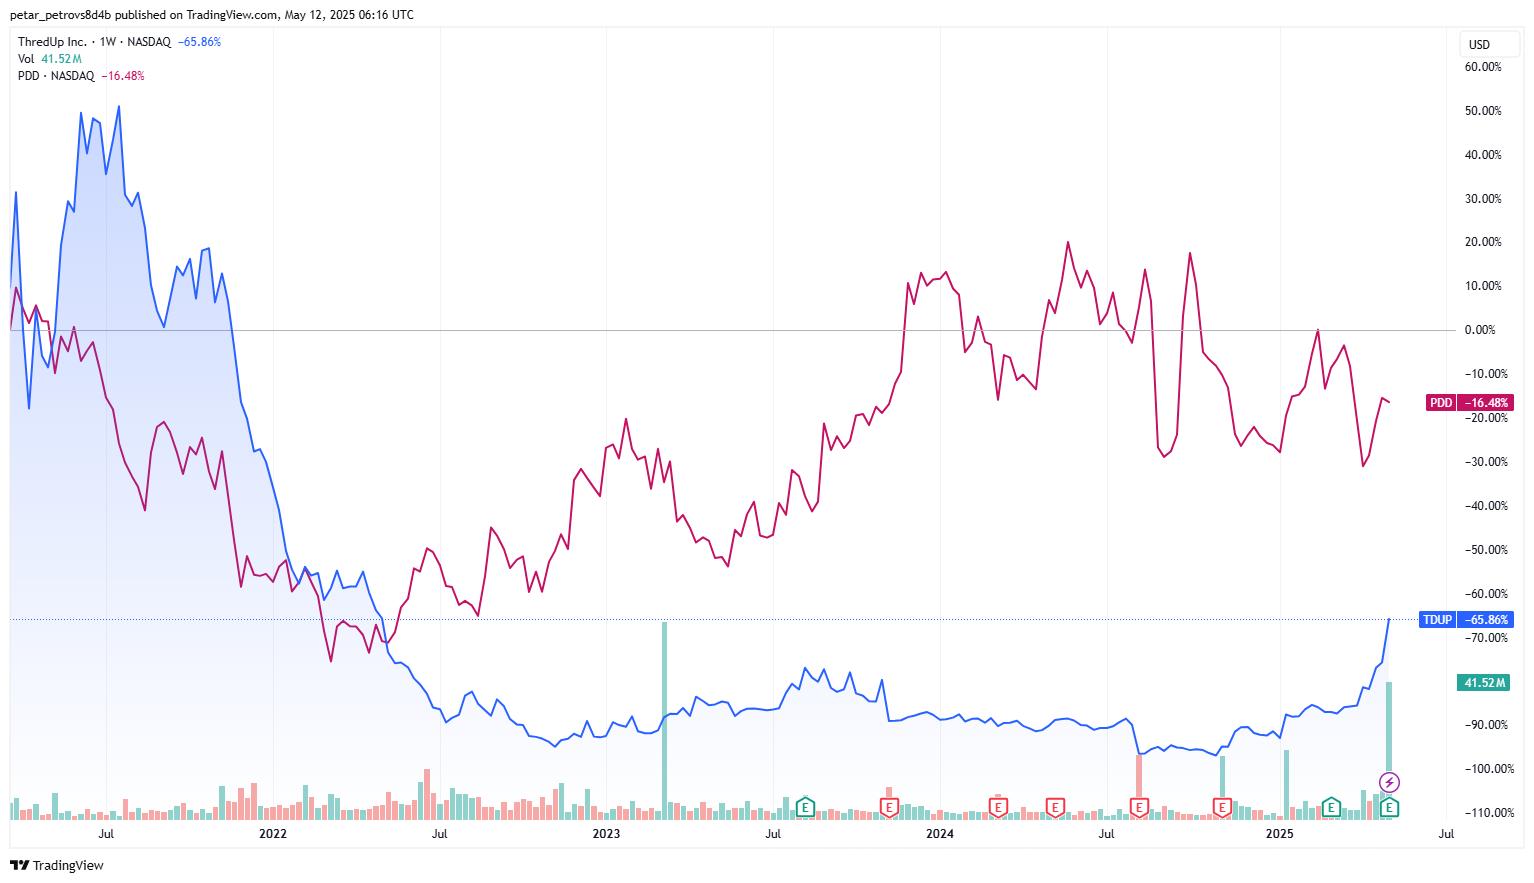
Source: TradingView
Source: TradingView
For investors, it is quite hard to predict the course of the tariffs and the economy in general. However, investors can hedge this risk by being bullish on companies with a rather negative correlation when it comes to the above-mentioned factors.
Recommended Articles


Comments (0)
Click the $ button, enter the symbol, and select to link a stock, ETF, or other ticker.