

データなし
検索
株式の株価
株式クォートでは、株価指数、セクター、関連する米国株式商品を含む、米国市場データに焦点を当てています。
52390.400-0.14%
7511.600+0.04%
29385.200+0.56%
分布状況
最新値
履歴
セクター
さらに見る
エネルギー - 化石燃料
+3.26%Battalion Oil Corp+17.64%
Kosmos Energy Ltd+16.67%
Vivakor Inc+16.16%
産業 & 商業サービス
+2.89%Baiya International Group Inc+737.36%
Mint Incorporation Ltd+36.76%
Eshallgo Inc+30.49%
投資持株会社
+1.76%Columbus Circle Capital I Ord Shs Class A+17.47%
Cantor Equity Partners III Ord Shs Class A+6.17%
Plum Acquisition Corp. IV+5.60%
保険
+1.12%Conifer Holdings Ord Shs+12.82%
Donegal Group Inc+9.17%
TRUP+6.04%
食品 & ドラッグストア
+0.68%LQR House Inc+10439.42%
Epsium Enterprise Ltd+6.25%
Caseys General Stores Inc+4.76%
ソフトウェア & ITサービス
+0.65%PSQ Holdings Inc+1104.66%
Sobr Safe Inc+174.56%
AlphaTON Capital Ord Shs+22.68%
ストックリスト
番号
銘柄名
価格
値動き
変動率%
合計スコア
時間
出来高
売買代金
時価総額
株数
振れ幅
出来高比率%
52週高値
52週安値
配当金
配当利回り
5日
10日
20日
60日
120日
250日
年初来
ウォッチリスト
株式分析
メモリ大手SKハイニックスの激しい株価変動:知っておくべきこと
TradingKey - 米東部時間7月10日、SKハイニックス(SKHY)のADRがNasdaqに上場し、265億ドルを調達して米国における外国企業によるIPOの過去最大記録を更新した。同ADRは取引初日に12.76%高で引けた。
TradingKey42 minutes ago
露光装置大手ASML 第2四半期決算プレビュー:AIサイクルの下での成長課題と地政学的リスク
TradingKey - 半導体製造装置の世界的大手ASMLは、2026年7月15日の米国市場開始前に2026年第2四半期決算を発表する。世界で唯一の極端紫外線(EUV)露光技術のプロバイダーであるASMLの業績は、自社の株価推移にとって極めて重要であるだけでなく、世界的なAIインフラ投資の勢いを示す重要な指標(ベルウェザー)としても機能している。
TradingKey53 minutes ago
ASML、決算を控え4%近く急落、1,700ドルの防衛線が脅かされる
ASMLは決算発表を控え、再び1,700ドルの節目を試している。この水準を維持できなければ、株価はさらに10%を超える下落に直面する可能性がある。
TradingKey3 hours ago

エヌビディアのアジア顧客が大規模再編:半数超がコンプライアンス審査に不合格、ホワイトリスト制度が世界の演算リソースの分配勢力図を塗り替える
TradingKey - 7月14日、フィナンシャル・タイムズの報道によると、米半導体大手エヌビディア(NVDA)は、同社の人工知能(AI)チップの購入を許可するアジアの顧客数を半分以下に削減した。この措置は、新たな顧客「ホワイトリスト」制度を構築し、コンプライアンス審査体制を強化することで、先端チップが第三者のルートを通じて中国市場へ流入するのを防ぐことを目的としている。
TradingKey3 hours ago

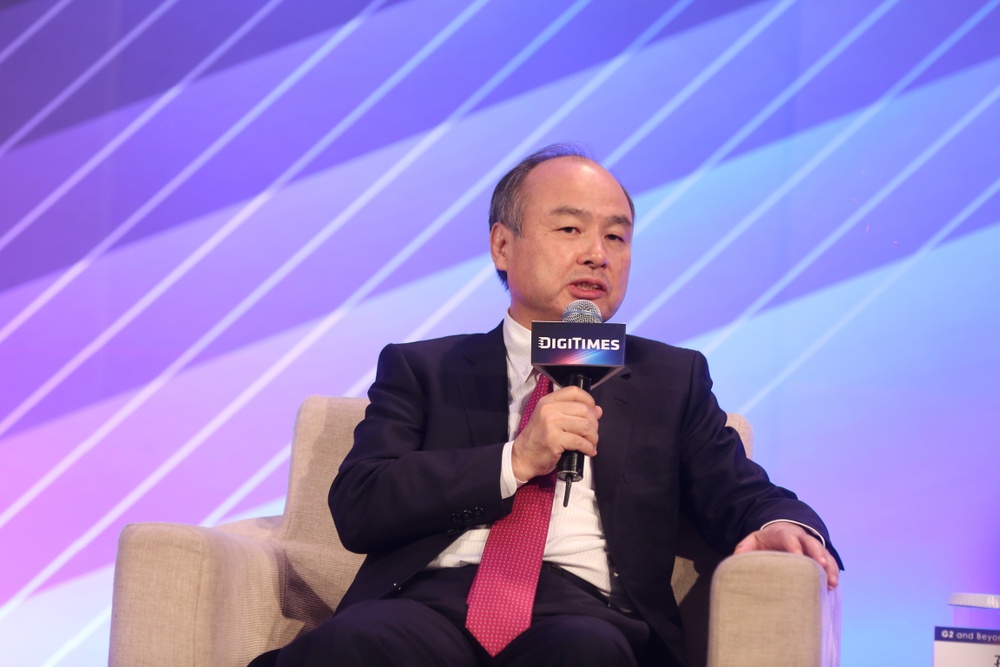
ソフトバンクの孫正義氏、2040年までにAIへの年間5兆ドルの投資が必要と主張、AIバブル説を「ばかげている」と一蹴
TradingKey - 7月14日のアジア市場の取引時間中、ソフトバンクグループの孫正義氏は、都内で開催された年次法人向け会議において、人工知能(AI)分野には2040年までに年間5兆ドル(約800兆円)の投資が必要になるとの予測を示した。同氏は、AIバブルに関する市場の懸念を「馬鹿げている」と一蹴した。
TradingKey3 hours ago
インテル、宇宙コンピューティング市場に初参入、18A採用の宇宙グレード・チップ「Starfire」を発表
TradingKey - インテル(INTC)は先日、コードネーム「Starfire」と呼ばれる宇宙グレードのシステム・オン・チップ(SoC)を発表し、同社初となる独自開発の専用チップによってスペースコンピューティング市場への本格参入を果たしました。この製品は主に人工衛星や宇宙船、その他極限環境下の機器向けに設計されており、民間宇宙航空、防衛、政府機関などの顧客による低消費電力、高信頼性、および人工知能(AI)演算能力への需要に応えることに注力しています。
TradingKey3 hours ago
TradingKey スマートピック

TK改良版 コリン・マクリーン グロース&バリュー・クオンツ戦略
スマートアルゴリズムを通じてファンダメンタル分析と市場行動を統合するこのアプローチは、現代市場におけるバリュー投資のアルファ(超過リターン)を高めるために、動的かつ多周波のシグナルを活用します。
保有銘柄の変更


ハワード・ロスマンの堅実な資産形成戦略
強気相場と弱気相場の両方に対応する、スマートな定量的アプローチ。安定した成長と的確なリスク管理を両立します。
保有銘柄の変更


デイビッド・ポーレン 合理的成長戦略
この戦略は、質の高いキャッシュフローを持つ企業を保有するというデイビッド・ポーレンの投資哲学を継承しつつ、インプライド・リターン(期待収益率)評価モデルを採用しています。定量的手法を用いることで、買入価格に対する成長性のバランスを追求し、高値を盲目的に追うことを避け、すべての保有銘柄が合理的な期待リターンを持つことを確実にします。
保有銘柄の変更


マイケル・J・カー 低収益成長戦略
この戦略は、マイケル・J・カーが提唱した「収益型投資」のフレームワークに基づいています。その原則は、市場の上げ下げを予測することではなく、市場の現在のリスク状態を判断し、それに基づいてリスクを取るべきか、どのように取るべきかを決定することにあります。
保有銘柄の変更


今後のイベント
財務諸表
配当金
株式分割
新規株式公開
2026-07-14
前場取引
JPMorgan Chase & Co
JPM
1株当たり利益予測値5.78
1株当たり利益 実績値--
売上高 予測値50.19B
売上高 実績値--
2026-07-14
前場取引
Bank of America Corp
BAC
1株当たり利益予測値1.13
1株当たり利益 実績値--
売上高 予測値30.75B
売上高 実績値--
2026-07-14
前場取引
Goldman Sachs Group Inc
GS
1株当たり利益予測値14.12
1株当たり利益 実績値--
売上高 予測値15.95B
売上高 実績値--
2026-07-14
前場取引
Fastenal Co
FAST
1株当たり利益予測値0.33
1株当たり利益 実績値--
売上高 予測値2.34B
売上高 実績値--
市場ヒートマップ
株式
業種