

データなし
検索
株式の株価
株式クォートでは、株価指数、セクター、関連する米国株式商品を含む、米国市場データに焦点を当てています。
52421.900-0.51%
7525.300-0.70%
29372.900-1.61%
分布状況
最新値
履歴
セクター
さらに見る
学術 & 教育サービス
+2.35%Mynd.ai Inc+6.82%
NetClass Technology Inc+6.25%
EpicQuest Education Group International Ltd+4.18%
化学
+1.05%Syntec Optics Holdings Inc+6.94%
Orion SA+6.55%
Gulf Resources Inc+4.36%
投資持株会社
+1.04%Securitize Ord Shs+7.25%
Black Hawk Acquisition Corp+4.56%
GSR IV Acquisition Corp+4.52%
公益事業
+0.56%Nuvve Holding Corp+55.69%
Sunation Energy Inc+49.61%
VivoPower Ord Shs+13.45%
ソフトウェア & ITサービス
+0.37%Global Mofy AI Ltd+147.03%
Snail Inc+26.67%
Rackspace Technology Inc+22.05%
パーソナルケア & 家庭用品
+0.18%WD-40 Co+10.65%
Medirom Healthcare Technologies Inc+6.00%
Yatsen Holding Ltd+4.96%
ストックリスト
番号
銘柄名
価格
値動き
変動率%
合計スコア
時間
出来高
売買代金
時価総額
株数
振れ幅
出来高比率%
52週高値
52週安値
配当金
配当利回り
5日
10日
20日
60日
120日
250日
年初来
ウォッチリスト
株式分析
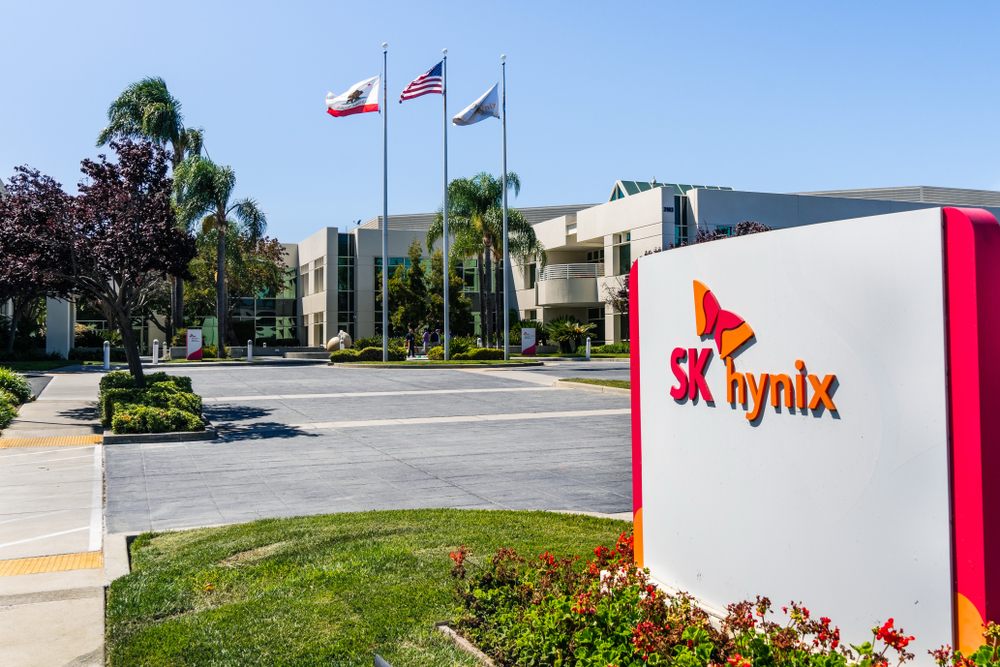
SKハイニックス、1,300ドルの防衛線を割り込み10%急落、韓国株式市場の下落を主導
SKハイニックスの株価は本日10%超急落し、200万ウォンの節目を割り込んで1カ月ぶりの安値を付けた。
TradingKey3 hours ago
日韓株式市場、安寄り後に上昇:サムスンとソフトバンクが引き続き相場を下支え、SKハイニックスとキオクシアは急落
日本と韓国の株式市場は、取引序盤の下げから回復して上昇に転じた。KOSPI指数と日経平均株価は小幅に上昇した。サムスン電子とソフトバンクは引き続き騰勢を強めた一方、SKハイニックスとキオクシアは軟調に推移した。
TradingKey5 hours ago

TradingKey デイリーマーケットブリーフ:SKハイニックスが取引初日に12%急騰、米イラン紛争で原油価格が急騰
TradingKey - 米東部時間7月10日、AIの成長や間近に迫った第2四半期決算シーズンを市場が引き続き織り込む中で、米国株式市場の主要3指数は上昇して取引を終えた。継続する米イラン間の緊張がエネルギー市場を混乱させているものの、投資家は企業の業績やAIインフラ投資、超大型ハイテク株のパフォーマンスへと再び関心を移した。
TradingKey5 hours ago
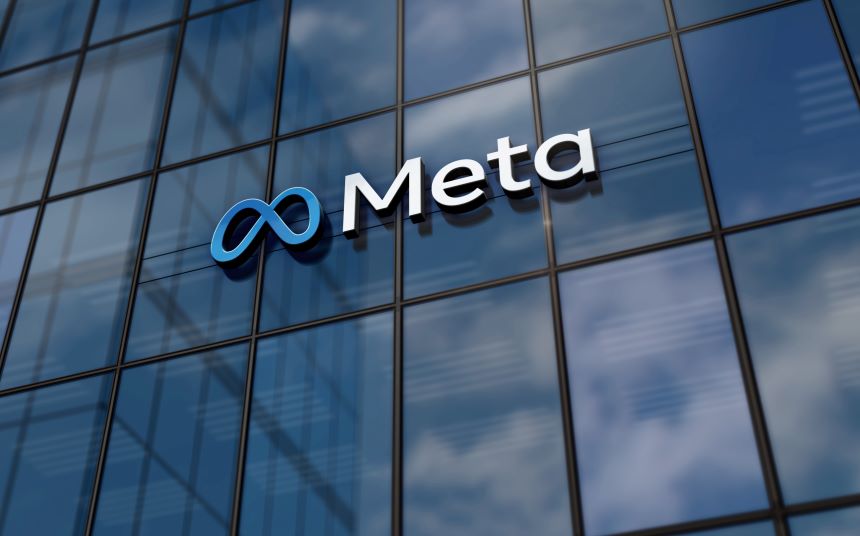
2026年後半のメタの株価はどう推移するか? 1,000ドルの大台に到達できるのか?
2026年上半期、エヌビディア、グーグル、アップルといったテック大手はいずれも史上最高値を更新した。しかし、メタ(META)はこうした水準に達することができなかっただけでなく、全体的に軟調な推移となり、同期間中に14%以上急落した。このパフォーマンスは米主要3指数を下回り、「マグニフィセント・セブン」の中でもマイクロソフトに次いでワースト2位となった。メタの下落トレンドは下半期も続くのか、それとも反転攻勢に転じて最高値を更新し、1,000ドルの大台に挑むのか。
TradingKey15 hours ago
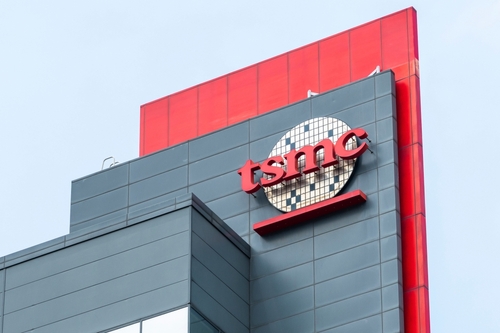
シティ、TSMCの目標株価を30%超引き上げ:決算説明会を前に知っておくべき重要事項
TradingKey - TSMC(TSM)の決算説明会は、世界的な半導体業界の指標としての役割を果たしています。世界最先端のファウンドリであるTSMCの稼働率、設備投資計画、およびAIチップ需要のガイダンスは、エヌビディア、AMD、アップルといったテック大手のサプライチェーン予測に直接影響を及ぼします。7月16日に予定されている次回の決算説明会において、市場はAI需要が引き続き予想を上回り続けるかどうかについての重要なシグナルを注視しています。 決算説明会の2週間足らず前となる7月6日、シティグループ(C)はリサーチレポートを公開し、TSMCの台湾上場株の目標株価を2,875台湾ドルから3,800台湾ドルに引き上げるとともに、「買い」評価を維持しました。現在の株価である約2,500台湾ドルに基づくと、この目標株価は約57%の上昇余地を示唆しています。
TradingKey20 hours ago
メタ株価予想:株価に強い上昇圧力、2026年後半もさらなる上昇は可能か?
TradingKey - 米国東部時間7月9日時点、Meta(META)は当日比4.7%高の631.48ドルで取引され、一時は日中高値の633.27ドルを記録した。Metaの株価は600ドルの節目を回復したものの、テクニカル指標は依然としてさらなる反落の可能性を示唆している。
TradingKeySun, Jul 12
TradingKey スマートピック

TK改良版 コリン・マクリーン グロース&バリュー・クオンツ戦略
スマートアルゴリズムを通じてファンダメンタル分析と市場行動を統合するこのアプローチは、現代市場におけるバリュー投資のアルファ(超過リターン)を高めるために、動的かつ多周波のシグナルを活用します。
保有銘柄の変更


ハワード・ロスマンの堅実な資産形成戦略
強気相場と弱気相場の両方に対応する、スマートな定量的アプローチ。安定した成長と的確なリスク管理を両立します。
保有銘柄の変更


デイビッド・ポーレン 合理的成長戦略
この戦略は、質の高いキャッシュフローを持つ企業を保有するというデイビッド・ポーレンの投資哲学を継承しつつ、インプライド・リターン(期待収益率)評価モデルを採用しています。定量的手法を用いることで、買入価格に対する成長性のバランスを追求し、高値を盲目的に追うことを避け、すべての保有銘柄が合理的な期待リターンを持つことを確実にします。
保有銘柄の変更


マイケル・J・カー 低収益成長戦略
この戦略は、マイケル・J・カーが提唱した「収益型投資」のフレームワークに基づいています。その原則は、市場の上げ下げを予測することではなく、市場の現在のリスク状態を判断し、それに基づいてリスクを取るべきか、どのように取るべきかを決定することにあります。
保有銘柄の変更


今後のイベント
財務諸表
配当金
株式分割
新規株式公開
2026-07-13
アフターマーケット
Grupo Aeromexico SAB de CV
AERO
1株当たり利益予測値-0.44
1株当たり利益 実績値--
売上高 予測値1.50B
売上高 実績値--
2026-07-13
アフターマーケット
Grupo Aeroportuario del Pacifico SAB de CV
PAC
1株当たり利益予測値3.49
1株当たり利益 実績値--
売上高 予測値590.34M
売上高 実績値--
2026-07-13
アフターマーケット
FB Financial Corp
FBK
1株当たり利益予測値1.15
1株当たり利益 実績値--
売上高 予測値177.99M
売上高 実績値--
2026-07-13
前場取引
LogProstyle Ord Shs
LGPS
1株当たり利益予測値--
1株当たり利益 実績値--
売上高 予測値--
売上高 実績値--
市場ヒートマップ
株式
業種