

データなし
検索
株式の株価
株式クォートでは、株価指数、セクター、関連する米国株式商品を含む、米国市場データに焦点を当てています。
52716.400+0.14%
7579.200+0.10%
29513.400+0.02%
分布状況
最新値
履歴
セクター
さらに見る
消費財コングロマリット
+5.02%Brookfield Business Corp+2.63%
3M Co+2.51%
Brookfield Infrastructure Partners LP+1.55%
産業 & 商業サービス
+3.76%Top KingWin Ltd+33.36%
PayPal Holdings Inc+17.20%
Mint Incorporation Ltd+14.34%
小売
+2.02%Lulu's Fashion Lounge Holdings Inc+14.32%
Fitell Ord Shs Class A+11.64%
MINISO Group Holding Ltd+9.28%
金融テクノロジー(Fintech) & インフラ
+1.50%Beneficient+14.41%
SMX (Security Matters) PLC+11.94%
USBC Ord Shs+11.75%
銀行 & 投資サービス
+1.35%Maase Ord Shs Class A+18.87%
Nvni Group Ltd+16.79%
TOP Financial Group Ltd+11.76%
投資持株会社
+1.34%Deep Fission Ord Shs+13.99%
Securitize Ord Shs+12.95%
Columbus Circle Capital I Ord Shs Class A+10.88%
ストックリスト
番号
銘柄名
価格
値動き
変動率%
合計スコア
時間
出来高
売買代金
時価総額
株数
振れ幅
出来高比率%
52週高値
52週安値
配当金
配当利回り
5日
10日
20日
60日
120日
250日
年初来
ウォッチリスト
株式分析
ASML株価予想:第2四半期決算の上振れとガイダンス引き上げ、株価は2,000ドル突破へ
TradingKey - 米国東部時間7月15日時点、ASMLの米国預託証券(ADR)は1,815.27ドルとなり、前日比2.23%上昇、日中高値は1,830ドルに達した。ASMLの株価は決算発表を受けて大幅に上昇したが、これは主に同社の第2四半期決算が市場予想を上回ったことや、通期の売上高見通しを再び引き上げたことが要因となっている。
TradingKeyan hour ago
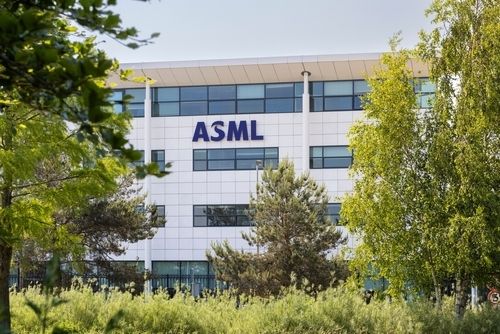
ASML、半導体製造装置の値上げを計画:株価を押し上げる可能性
TradingKey - 米国東部時間7月15日、世界最大の露光装置メーカーであるASMLは、先端半導体製造装置への需要が拡大し続ける中、一部製品の価格をさらに引き上げる余地があるとの見解を示した。ASMLのロジャー・ダッセンCFOは、現在の市場環境は装置の値上げにおいて有利な状況にあると指摘。同社は現在、顧客と価格交渉を行っているが、具体的な値上げ幅や実施時期についてはまだ発表されていない。
TradingKey2 hours ago

韓国、3年半ぶりの利上げ:韓国株の下げ幅拡大、KOSPIは6%超急落、SKハイニックスは11%超暴落
韓国銀行による利上げ発表が株式市場の売りを誘い、KOSPIは6%急落した。サムスン電子は8%超下落し、SKハイニックスは11%を超える急落となった。
TradingKey4 hours ago

日韓株式、寄り付きで急落:KOSPIは5%安、SKハイニックスは9%暴落、サムスン、キオクシア、ソフトバンクも連れ安
日本と韓国の株式市場は大幅安で寄り付き、韓国総合株価指数(KOSPI)は5%急落、日経平均株価は2%超下落した。SKハイニックスが9%を超える下落で下げを主導し、サムスン電子、キオクシア、ソフトバンクもこれに追随して値を下げた。
TradingKey5 hours ago

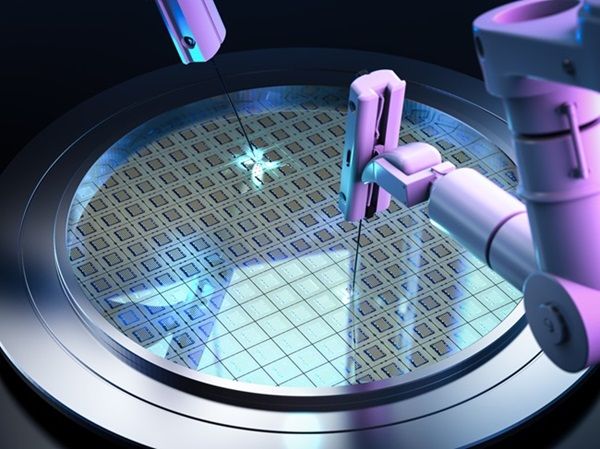
AIセクターの調整後、資金は新たな確実性を模索:半導体製造装置株は次の主要テーマとなるか?
TradingKey — ついに「ツルハシ売り」の時代が到来したのでしょうか。HBMの増産、米国での半導体工場の着工、そして先端パッケージングの規模拡大が進む中、半導体製造装置株への投資論拠は静かに変化しつつあります。
TradingKey3 hours ago
TradingKey デイリーマーケットブリーフ:予想外のPPI低下が相場を支援、アップルが史上最高値を更新、AIハードウェア銘柄は引き続き軟調、マイクロンとサンディスクが下落
TradingKey - 米国東部時間7月15日、米主要3株価指数は2営業日連続で続伸して取引を終えた。6月の米卸売物価指数(PPI)が予想外の低下となったことでインフレ沈静化への期待が一段と強まったほか、企業決算シーズンの開幕が市場予想を上回り続けていることも株式市場への資金回帰を促した。米・イラン間の対立継続や原油価格の高止まりは続いているものの、投資家はディスインフレや収益の底堅さ、そして取引時間中のメガキャップ・ハイテク株の動向をより重視した。
TradingKey4 hours ago
TradingKey スマートピック

TK改良版 コリン・マクリーン グロース&バリュー・クオンツ戦略
スマートアルゴリズムを通じてファンダメンタル分析と市場行動を統合するこのアプローチは、現代市場におけるバリュー投資のアルファ(超過リターン)を高めるために、動的かつ多周波のシグナルを活用します。
保有銘柄の変更


ハワード・ロスマンの堅実な資産形成戦略
強気相場と弱気相場の両方に対応する、スマートな定量的アプローチ。安定した成長と的確なリスク管理を両立します。
保有銘柄の変更


デイビッド・ポーレン 合理的成長戦略
この戦略は、質の高いキャッシュフローを持つ企業を保有するというデイビッド・ポーレンの投資哲学を継承しつつ、インプライド・リターン(期待収益率)評価モデルを採用しています。定量的手法を用いることで、買入価格に対する成長性のバランスを追求し、高値を盲目的に追うことを避け、すべての保有銘柄が合理的な期待リターンを持つことを確実にします。
保有銘柄の変更


マイケル・J・カー 低収益成長戦略
この戦略は、マイケル・J・カーが提唱した「収益型投資」のフレームワークに基づいています。その原則は、市場の上げ下げを予測することではなく、市場の現在のリスク状態を判断し、それに基づいてリスクを取るべきか、どのように取るべきかを決定することにあります。
保有銘柄の変更


今後のイベント
財務諸表
配当金
株式分割
新規株式公開
2026-07-16
前場取引
Unitedhealth Group Inc
UNH
1株当たり利益予測値4.86
1株当たり利益 実績値--
売上高 予測値110.82B
売上高 実績値--
2026-07-16
前場取引
General Electric Co
GE
1株当たり利益予測値1.86
1株当たり利益 実績値--
売上高 予測値11.85B
売上高 実績値--
2026-07-16
前場取引
Prologis Inc
PLD
1株当たり利益予測値0.79
1株当たり利益 実績値--
売上高 予測値2.23B
売上高 実績値--
2026-07-16
前場取引
US Bancorp
USB
1株当たり利益予測値1.28
1株当たり利益 実績値--
売上高 予測値7.58B
売上高 実績値--
市場ヒートマップ
株式
業種