

Sem dados
Pesquisar
Cotações de Ações
As cotações de ações são focadas no mercado dos EUA, incluindo índices, setores e outros ativos de renda variável relacionados.
52378.000+0.21%
7475.100+0.41%
28160.900-0.13%
Distribuição
Últimas
Histórico
Setor
Ver Mais
Serviços Públicos
+858.66%Blink Charging Co+5.51%
Founder Group Ltd+4.07%
WaterBridge Infrastructure LLC+3.95%
Varejo
+8.64%Amazon.com Inc+15.32%
Leslie's Inc+9.56%
Jiuzi Holdings Inc+9.02%
Investimentos Coletivos
+4.11%Oxford Square Capital Corp+7.64%
Apollo Global Management Inc+4.53%
OFS Capital Corp+2.13%
Bens Industriais
+1.23%ARXS.NB+10.86%
CVD Equipment Corp+10.75%
SPX Technologies Inc+10.08%
Energia - Combustíveis Fósseis
+0.89%Recon Technology Ltd+25.95%
Forum Energy Technologies Inc+21.68%
Sable Offshore Corp+18.08%
Produtos de Consumo Cíclicos
+0.72%Kandal M Venture Ltd+141.41%
Purple Innovation Inc+11.42%
K-Tech Solutions Co Ltd+11.27%
Lista de Ações
N.º
Nome
Preço
Variação
Var. %
Pontuação total
Tempo
Volume
Volume
Valor de mercado
Ações
Amplitude
Índice de Volume
Máx. 52 Sem.
Mín. 52 Sem.
Dividendo
Div. Yield
5D
10D
20D
60D
120D
250D
Ano até a data
Minha lista
Análise de Ações
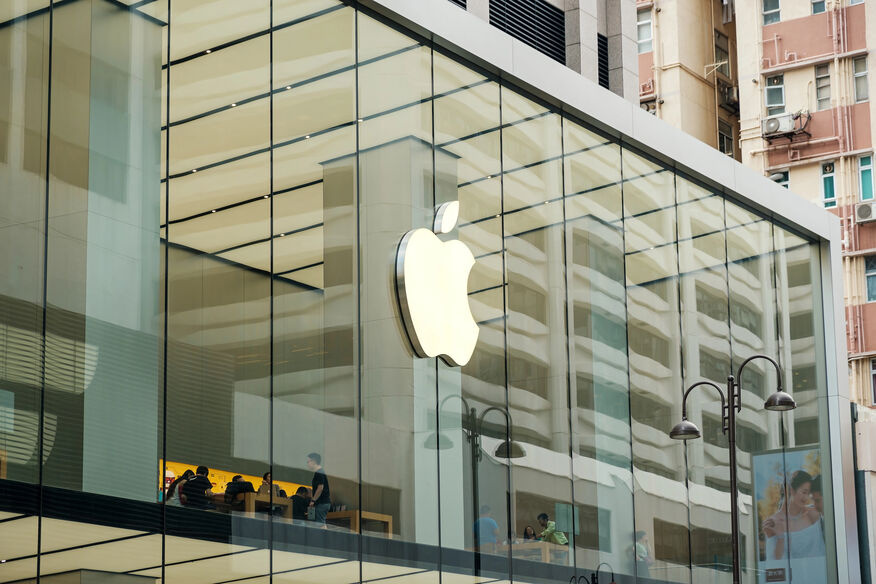
Previsão do Preço das Ações da Apple: O AAPL Pode Ultrapassar US$ 400 até 2026? Análise do Preço-Alvo Mais Alto de Wall Street
A Apple apresentou o desempenho mais forte entre as "Sete Magníficas", impulsionada por lucros recordes, recompras robustas de ações e uma estratégia de IA com baixo Capex, enquanto o preço de suas ações ultrapassou US$ 340 e sua capitalização de mercado atingiu US$ 5 trilhões. Apesar da pressão de curto prazo decorrente de condições de sobrecompra e correções técnicas, as instituições de Wall Street permanecem amplamente otimistas quanto aos seus fundamentos, com os preços-alvo mais elevados atingindo US$ 400.
TradingKeyhá uma hora
Nvidia Acusada de ‘Financiamento Circular’ em Acordo de US$ 750 Bilhões com SK Group e OpenAI: Por que o Mercado Está em Pânico
TradingKey - De acordo com relatos da imprensa, a Nvidia (NVDA) está avançando em uma nova rodada de acordos de infraestrutura de IA que podem totalizar mais de US$ 750 bilhões, incluindo um acerto superior a US$ 500 bilhões com o grupo sul-coreano SK Group e negociações com a OpenAI para até US$ 250 bilhões em garantias de leasing. No entanto, o mercado demonstra preocupação de que tais modelos de "financiamento circular" possam estar distorcendo a demanda real dentro da indústria de IA.
TradingKeyhá 7 horas
Previsão do preço das ações da Intel: Após queda de mais de 30% em julho, as ações cairão ainda mais?
TradingKey - Em 29 de julho, horário do Leste, as ações da Intel (INTC) registraram um recuo acumulado de mais de 30% em relação ao seu pico do final de junho, entrando em uma zona de correção técnica. Apesar de os resultados recentemente divulgados do segundo trimestre fiscal de 2026 da empresa terem superado as expectativas do mercado de forma generalizada e de uma revisão para cima em seu guidance para o terceiro trimestre, a ação não conseguiu sustentar seu rali anterior e, em vez disso, continuou a enfrentar pressão.
TradingKeyhá 12 horas
Previsão do Preço das Ações da SpaceX: As Ações Podem se Recuperar de um Valor de Mercado Subvalorizado?
Em 28 de julho (horário do Leste), a SpaceX (SPCX) atingiu uma nova mínima histórica intradiária de US$ 107,01, fechando a , em queda de quase em relação ao seu preço de IPO e mais de 50% abaixo de seu pico. Segundo relatos, o propulsor não conseguiu realizar uma recuperação perfeita durante o 13º voo de teste da Starship. Enquanto isso, com a aproximação da expiração do lock-up, os investidores têm vendido ações da SpaceX, e a busca da ação por um fundo continua. No entanto, após uma correção de seis semanas, a capitalização de mercado caiu para US$ 1,43 trilhão. À medida que as bolhas de valuation continuam a desinflar, surge a questão: a SpaceX verá uma recuperação de preços?
TradingKeyhá 16 horas
Índice Nasdaq Composite sobe 1% com disparada de 15% da Amazon após resultados; Apple e Micron caem com recuo de ações de memória
Os balanços financeiros divulgados pela Amazon e pela Microsoft forneceram ao mercado uma cadeia de transmissão clara do investimento em IA para a receita. Os três principais índices estenderam os ganhos de ontem, com as ações de tecnologia de grande capitalização liderando o avanço, enquanto as ações de memória registraram um leve recuo. No fechamento, o Dow Jones Industrial Average subiu 0,53%, para 52.485,03; o Nasdaq Composite subiu 1,00%, para 25.373,85; e o S&P 500 subiu 0,70%, para 7.489,72.
TradingKeyhá 20 horas
Ações da Micron caem 30% desde a máxima de junho: o superciclo de memórias de IA acabou?
TradingKey - Após quase um ano de ganhos significativos, as ações da Micron Technology (MU) entraram recentemente em uma fase de correção em níveis elevados. Em 28 de julho, o preço das ações da Micron fechou em US$ 820, um recuo de aproximadamente 30% em relação à máxima histórica atingida no final de junho.
TradingKeyhá 21 horas

TradingKey SmartPicks

Estratégia Quantitativa de Crescimento e Valor de Colin McLean Aprimorada pela TK
Combinando fundamentos e comportamento de mercado por meio de algoritmos inteligentes, esta abordagem utiliza sinais dinâmicos e multifrequenciais para ampliar o alfa do investimento em valor nos mercados modernos.
Variação


Estratégia de Riqueza Prudente de Howard Rothman
Um método quantitativo inteligente que se adapta dinamicamente a mercados de alta e baixa — oferecendo a combinação perfeita de crescimento estável e controle preciso de risco.
Variação


Estratégia de Crescimento Racional de David Polen
Essa estratégia dá continuidade à filosofia de investimento de David Polen, focada na manutenção de empresas com fluxos de caixa de alta qualidade, incorporando o modelo de avaliação por taxa de retorno implícita. O objetivo é buscar um crescimento equilibrado em relação ao preço de entrada, por meio de métodos quantitativos, evitando a busca cega por ativos caros e garantindo que cada posição possua um retorno esperado razoável.
Variação


Estratégia de Crescimento com Baixo Risco de Michael J. Carr
Essa estratégia é baseada no conceito de “investimento lucrativo” proposto por Michael J. Carr. Seu princípio central não é prever as altas e quedas do mercado, mas identificar o estado atual de risco do mercado e, a partir disso, decidir se e como assumir riscos.
Variação


Próximos eventos
Declarações
Dividendo
Desdobramento de ações
IPO
2026-08-03
Pré-mercado
Marriott International Inc
MAR
Previsão por Ação3.09
LPA Atual--
Previsão de receita7.20B
Receita atual--
2026-08-03
Pré-mercado
Tyson Foods Inc
TSN
Previsão por Ação0.99
LPA Atual--
Previsão de receita14.12B
Receita atual--
2026-08-03
Pré-mercado
Avista Corp
AVA
Previsão por Ação0.24
LPA Atual--
Previsão de receita419.21M
Receita atual--
2026-08-03
Pré-mercado
Kosmos Energy Ltd
KOS
Previsão por Ação0.09
LPA Atual--
Previsão de receita477.17M
Receita atual--
Termômetro do mercado
Ações
Setor