Indicators
Indicators
Value
Direction
MACD(12,26,9)
-0.253
Sell
RSI(14)
35.528
Neutral
STOCH(KDJ)(9,3,3)
24.000
Neutral
ATR(14)
0.925
High Vlolatility
CCI(14)
-102.830
Sell
Williams %R
73.420
Sell
TRIX(12,20)
-0.091
Sell
StochRSI(14)
79.133
Buy


109.742
Today
+0.22%
5 Days
-0.69%
1 Month
-3.52%
6 Months
-0.39%
Year to Date
+4.94%
1 Year
+13.04%
Opening Price
109.505Previous Closing Price
109.502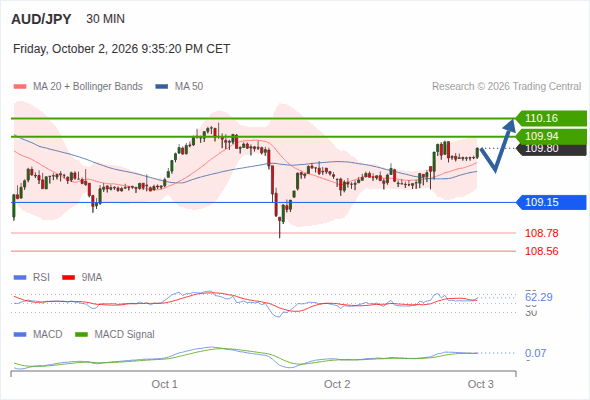
Rebound above 109.15 towards 110.16
below 109.15, expect 108.78 and 108.56.
Rebound above 109.15 towards 110.16
The Australian Dollar (AUD) turns flat at around 109.50 against the Japanese Yen (JPY) during the European trading session on Friday after recovering early losses.
The AUD/JPY cross trades in negative territory near 109.40 during the early European trading hours on Friday.
The AUD/JPY cross trades in positive territory around 109.95 during the early European session on Thursday.
AUD/JPY halts its seven-day losing streak, trading around 109.80 during Asian hours on Thursday. The currency cross remains stronger as the Australian Dollar (AUD) holds gains following the release of domestic Trade Balance data.
The AUD/JPY cross remains under heavy selling pressure for the second consecutive day, falling to a six-month low during the Asian session on Wednesday following the release of Australian consumer inflation figures.
The AUD/JPY cross attracts fresh sellers following the post-Reserve Bank of Australia (RBA) uptick to the 110.70 region and drops to an over two-week low during the early part of the European session on Tuesday.
The Indicators feature provides value and direction analysis for various instruments under a selection of technical indicators, together with a technical summary.
This feature includes nine of the commonly used technical indicators: MACD, RSI, KDJ, StochRSI, ATR, CCI, WR, TRIX and MA. You may also adjust the timeframe depending on your needs.
Please note that technical analysis is only part of investment reference, and there is no absolute standard for using numerical values to assess direction. The results are for reference only, and we are not responsible for the accuracy of the indicator calculations and summaries.