

Lockheed Martin Corp
LMTToday
-3.42%
5 Days
-6.95%
1 Month
-7.45%
6 Months
+2.05%
Year to Date
+2.03%
1 Year
+4.87%
TradingKey Stock Score of Lockheed Martin Corp
Currency: USD Updated: 2026-06-22Key Insights
Lockheed Martin Corp's fundamentals are relatively stable, and its growth potential is significant.Its valuation is considered fairly valued, ranking 50 out of 74 in the Aerospace & Defense industry.Institutional ownership is very high.Over the past month, multiple analysts have rated it as Hold, with the highest price target at 625.51.In the medium term, the stock price is expected to trend down.Despite a weak stock market performance over the past month, the company shows strong technicals.The stock price is trading sideways between the support and resistance levels, making it suitable for range-bound swing trading.
Lockheed Martin Corp's Score
Support & Resistance
Score Analysis
Media Coverage
Lockheed Martin Corp Highlights
Analyst Rating
Lockheed Martin Corp News
Trump Proposes $1.5 Trillion Defense Budget, Which Defense Stocks Are Worth Investing In?
TradingKey - Trump recently unveiled a $1.5 trillion defense budget proposal, focusing on three key areas: space defense, shipbuilding, and missile systems. The market immediately interpreted the announcement as a signal for a new defense industry growth cycle, bringing relevant US aerospace and def

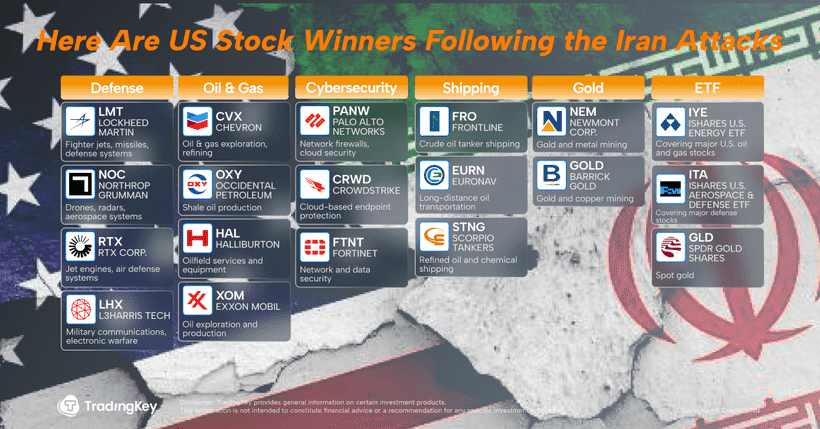
Here Are US Stock Winners Following the Iran Attacks
Tradingkey - On Tuesday, U.S. equities extended their slide as rising oil prices and the specter of war in Iran rippled through global markets. The Dow Jones Industrial Average at one point plunged more than 1,000 points.
Markets Sell Off amid Iran Tensions — But Oil and Defense Stocks Hold Up
TradingKey - Following U.S. and Israeli airstrikes on Iran, investors are watching closely to see how U.S. markets will open on Monday. Early declines in Asia and Europe suggest pressure on equities, yet the sharp surge in oil prices could offer a lifeline for the energy sector.

US-Iran Conflict Ignites, Global Arms Race Heats Up, Will Defense Stocks See a New Round of Gains?
TradingKey - On February 28 local time, the United States and Israel launched joint large-scale airstrikes against Iran, targeting its nuclear facilities, missile industry, and naval forces. This marks another sharp escalation in the conflict following the US military strikes on Iranian nuclear facilities in June last year. The military operation not only exacerbates already strained geopolitical tensions but has also sent shockwaves through global capital markets, which is expected to further boost defense stocks.

Lockheed Martin (LMT): Robust Backlog & Geopolitical Tailwinds Bolster Long-Term Outlook Despite Short-Term Project Setbacks
TradingKey - The U.S. is increasing defense spending significantly over the years due to rising global tensions and the need to modernize its military capabilities. The defense sector has outperformed broader markets fueled by reliable government contracts and innovation.
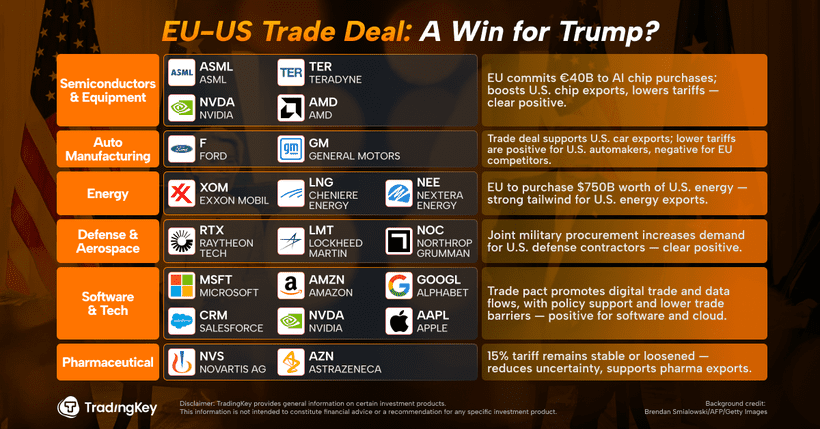
EU-US Trade Deal: A Win for Trump?
TradingKey - Markets have been buzzing this week around the new trade deal announced between the U.S. and the European Union. But while headlines touted a breakthrough, the details—and the politics—tell a more complicated story.
Financial Indicators
EPS
Total revenue
Lockheed Martin Corp Info
Related Instruments
Popular Instruments
