

SanDisk Corporation
SNDKToday
-1.93%
5 Days
-9.82%
1 Month
+20.97%
6 Months
+739.46%
Year to Date
+763.76%
1 Year
+4248.65%
SanDisk Corporation News
Micron, SanDisk Both Plunge Over 6%; Apple, Microsoft Price Hikes Backfire on Market, Memory Stocks Face Loosening Earnings Logic
On June 29, Eastern Time, US memory stocks fell collectively after the South Korean government announced its largest-ever investment plan for the semiconductor and artificial intelligence (AI) industries, with SanDisk (SNDK) and Micron (MU) both dropping over 6%. This serves as another new catalyst for the memory sector following Micron Technology's release of optimistic earnings guidance last week. However, judging from today's market reaction, investors do not seem to be buying into it. Meanwhile, reports that Apple and Microsoft's Xbox raised prices on the same day last week have prompted the market to reassess whether the current sharp rise in memory prices driving the chip sector's earnings expansion is coming at the expense of sustained pressure on end-consumer demand.
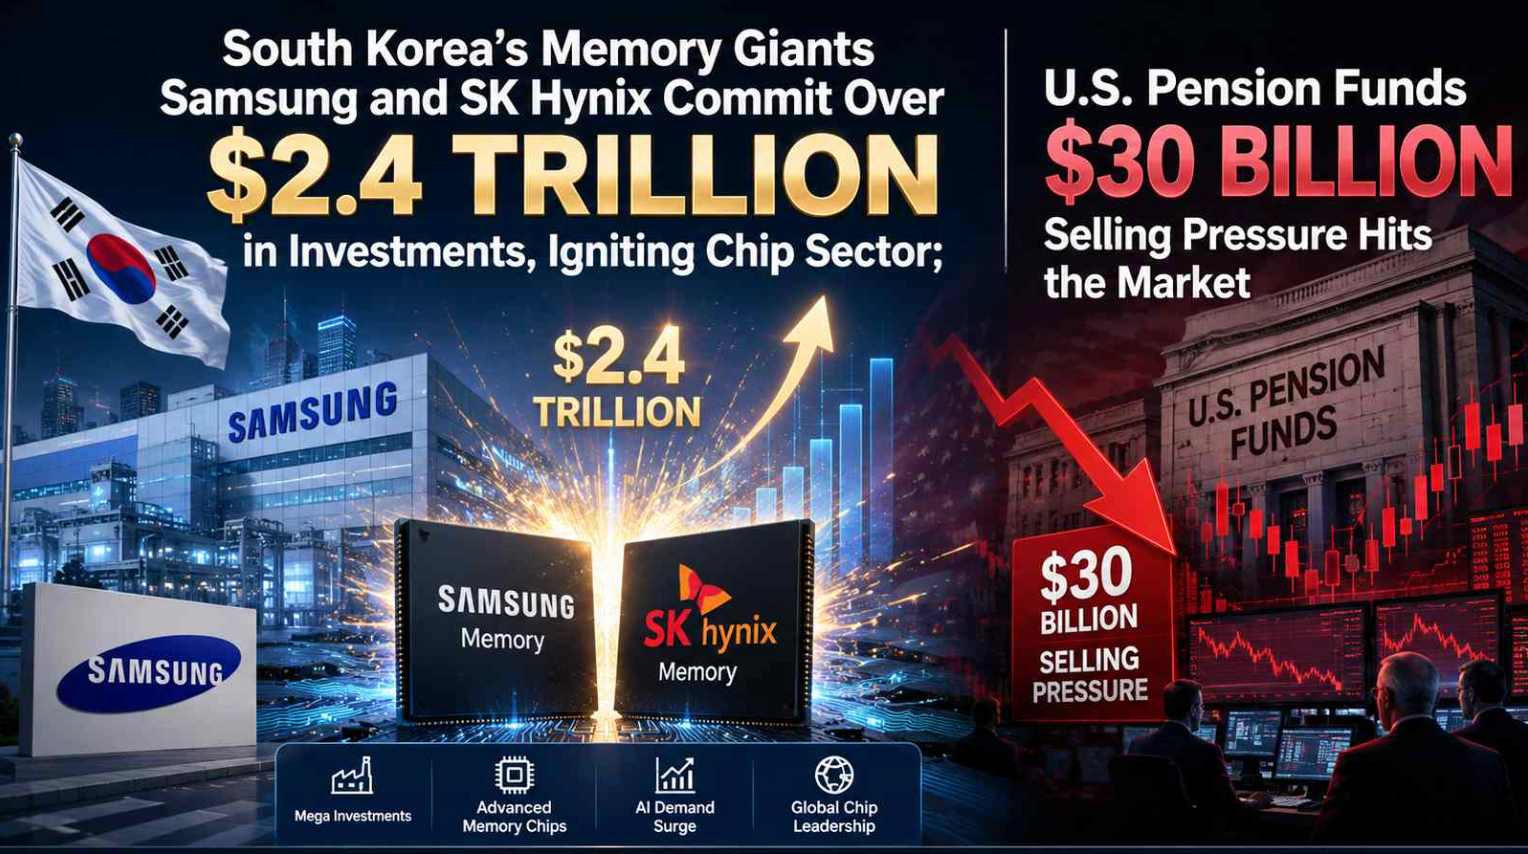
US Pre-Market: Korean Memory Giants Samsung and SK Hynix's Combined Investment of Over $2.4 Trillion Boosts Chip Sector, as US Pensions' $30 Billion Selling Pressure Hits
TradingKey - On June 29 Eastern Time, in US premarket trading, the three major stock index futures rose collectively. As of press time, Dow Jones futures rose 0.46%, Nasdaq 100 futures rose 1.19%, and S&P 500 futures rose 0.85%.
Sandisk (SNDK) Weekend Outlook: Can the S&P 500's Best Stock Extend Its 857% Rally?
TradingKey - Sandisk (SNDK) enters the new week after an 857% rally in 2026. Here's what to watch, including Micron's record quarter, Core PCE, NAND demand, and key risks.

Memory Giant SK Hynix Nears US Listing: Some Key Information You Need to Know
TradingKey - In June 2026, South Korean memory giant SK Hynix is accelerating its push into Wall Street. The dominant leader in the global HBM (High Bandwidth Memory) market plans to list on Nasdaq by issuing American Depositary Receipts (ADRs) under the ticker symbol "SKHY," in what will be one of the largest U.S. listings by a foreign company in recent years.
SanDisk Stock Has Skyrocketed 6,500% Since Spinning Off From Western Digital. Can You Buy This AI Storage Leader Now?
TradingKey - In February 2025, SanDisk (SNDK) spun off from Western Digital (WDC) to become an independent, publicly listed company focusing on the NAND flash memory business. Little did anyone expect that this storage manufacturer, whose value was once overshadowed by its parent company's diversification strategy, would go on to create a legend in the US stock market, propelled by the AI wave.
TradingKey Daily Market Briefing: PCE Inflation Hits Three-Year High, Micron Leads Chip Stocks, Apple Falls Over 6%
TradingKey - On June 25, Eastern Time, the three major US stock indexes closed mixed. Strong earnings from Micron (MU) reignited trading in AI memory and semiconductors, but declines in Apple (AAPL) and several mega-cap tech stocks offset the support from the rebound in chip stocks. Meanwhile, US May PCE inflation rose to a three-year high, and the market remained cautious about the Federal Reserve's subsequent rate hike path.

Popular Instruments
