tradingkey.logo
XAUUSD

SGD/JPY

SGDJPY
取引終了
詳細チャートを表示

118.127JPY

-0.318-0.27%
Time
1m
15m
30m
1h
4h
D
W
Please select

本日

-0.27%

5日間

+0.54%

1ヶ月

+3.43%

6ヶ月

+6.51%

年初来

+2.88%

1年間

+2.81%

詳細チャートを表示

主要データ

始値

118.4

前日終値

118.445
当日値幅
118.127118.669
52週価格レンジ
0.000118.127

指標

本指標機能は、各種テクニカル指標を用いて金融商品の数値分析と方向性評価を提供し、技術的な要約を表示します。

本機能ではMACD・RSI・KDJ・StochRSI・ATR・CCI・WR・TRIX・MAの9種類の主要テクニカル指標を網羅しています。時間軸はご自身のニーズに合わせて調整可能です。

テクニカル分析は投資判断の一要素に過ぎず、数値による方向性評価に絶対的な基準はありません。表示結果はあくまで参考情報であり、指標計算・要約の正確性について当方は責任を負いかねます。
1分
5分
15分
30分
1時間
2時間
4時間
日足
週足
月足
1分
5分
15分
日足
買い
売り(2)
中立(1)
買い(8)
指標
売り(2)
中立(1)
買い(2)
指標
数値
方向性
MACD(12,26,9)
0.189
買い
RSI(14)
63.200
中立
STOCH(KDJ)(9,3,3)
82.895
買われ過ぎ
ATR(14)
0.720
低変動率
CCI(14)
129.657
買い
Williams %R
16.389
買われ過ぎ
TRIX(12,20)
0.082
売り
StochRSI(14)
40.986
売り
移動平均
売り(0)
中立(0)
買い(6)
指標
数値
方向性
MA5
117.904
買い
MA10
117.494
買い
MA20
117.154
買い
MA50
115.768
買い
MA100
115.053
買い
MA200
113.195
買い

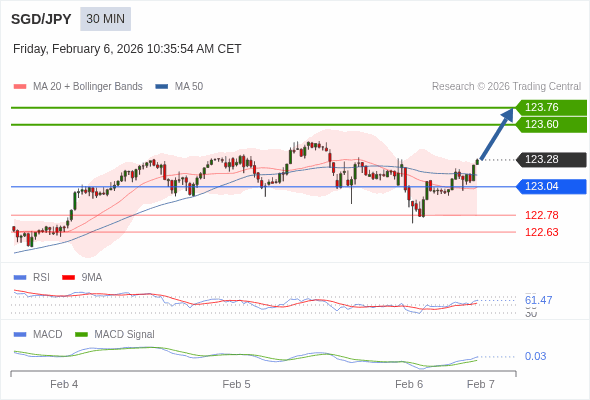
SGD/JPY 取引戦略

日中取引
短期
The configuration is positive.

取引戦略

The configuration is positive.

代替シナリオ

below 118.31, expect 118.00 and 117.82.

コメント

the upside prevails as long as 118.31 is support

Fri, Oct 31
情報源:Trading Central(参考データ)

SGD/JPY ニュース

最新情報をお待ちください...

詳細情報 SGD/JPY

The SGD/JPY currency pair represents the exchange rate between the Singapore Dollar (SGD) and the Japanese Yen (JPY). This pair is significant for traders and investors involved in the Asia-Pacific region, reflecting the economic dynamics between Singapore and Japan. Factors influencing the SGD/JPY exchange rate include interest rates, economic performance, trade relations, and geopolitical developments.

SGD/JPY

118.127
-0.318-0.27%
KeyAI