tradingkey.logo
XAUUSD

WTI

USOIL
詳細チャートを表示

64.561USD

-0.037-0.06%
Time
1m
15m
30m
1h
4h
D
W
Please select

本日

-0.06%

5日間

-12.09%

1ヶ月

+6.54%

6ヶ月

-7.83%

年初来

-9.72%

1年間

-19.78%

詳細チャートを表示

主要データ

始値

64.685

前日終値

64.598
当日値幅
64.37565.249
52週価格レンジ
0.00064.561

指標

本指標機能は、各種テクニカル指標を用いて金融商品の数値分析と方向性評価を提供し、技術的な要約を表示します。

本機能ではMACD・RSI・KDJ・StochRSI・ATR・CCI・WR・TRIX・MAの9種類の主要テクニカル指標を網羅しています。時間軸はご自身のニーズに合わせて調整可能です。

テクニカル分析は投資判断の一要素に過ぎず、数値による方向性評価に絶対的な基準はありません。表示結果はあくまで参考情報であり、指標計算・要約の正確性について当方は責任を負いかねます。
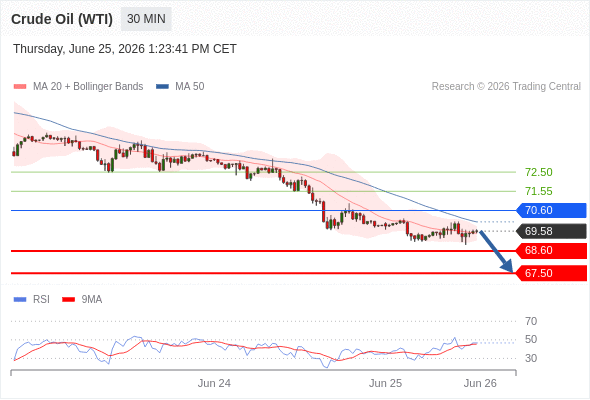
1分
5分
15分
30分
1時間
2時間
4時間
日足
週足
月足
1分
5分
15分
日足
売り
売り(7)
中立(3)
買い(1)
指標
売り(2)
中立(3)
買い(0)
指標
数値
方向性
MACD(12,26,9)
-0.859
中立
RSI(14)
46.213
中立
STOCH(KDJ)(9,3,3)
18.921
売り
ATR(14)
3.749
高変動率
CCI(14)
-71.344
中立
Williams %R
83.720
売られ過ぎ
TRIX(12,20)
0.624
売り
StochRSI(14)
0.000
売られ過ぎ
移動平均
売り(5)
中立(0)
買い(1)
指標
数値
方向性
MA5
68.933
売り
MA10
69.996
売り
MA20
66.480
売り
MA50
63.162
買い
MA100
65.461
売り
MA200
68.242
売り

WTI 取引戦略

日中取引
中期
短期
Short positions below 67.10 with targets at 64.05 & 62.75 in extension.

取引戦略

Short positions below 67.10 with targets at 64.05 & 62.75 in extension.

代替シナリオ

above 67.10 look for further upside with 68.90 & 70.20 as targets.

コメント

short positions below 67.10 with targets at 64.05 & 62.75 in extension.

2 hours ago
情報源:Trading Central(参考データ)

WTI ニュース

最新情報をお待ちください...

詳細情報 WTI

USOIL, commonly referred to as West Texas Intermediate (WTI) crude oil, is a light, sweet crude oil that serves as one of the primary benchmarks for oil pricing in the global market. Sourced primarily from oil fields in the United States, particularly in Texas and Oklahoma, WTI crude oil is known for its API gravity of around 39.6 degrees, which classifies it as ‘light,’ and its low sulfur content, which makes it ‘sweet.’ These characteristics make WTI crude highly desirable for refining into gasoline, diesel, and other high-value petroleum products. The price of USOIL is set on the New York Mercantile Exchange (NYMEX) and is traded in the form of futures contracts, which allow market participants to buy and sell the commodity for delivery at a future date. These contracts are standardized, with each representing 1,000 barrels of crude oil. The USOIL futures market is one of the most liquid in the world, attracting a diverse range of traders, including producers, refiners, hedge funds, and individual investors. The price of USOIL is influenced by a complex interplay of factors, including: Global supply and demand dynamics: Fluctuations in oil production, particularly from major producers like the United States, Russia, and Saudi Arabia, as well as changes in global consumption patterns, can significantly impact prices. OPEC and non-OPEC production quotas: Decisions by the Organization of the Petroleum Exporting Countries (OPEC) and its allies to increase or decrease oil production can cause substantial price movements. Geopolitical events: Conflicts, sanctions, and political instability in oil-producing regions can lead to supply disruptions and volatility in oil prices. Economic indicators: The health of the global economy, as indicated by GDP growth rates, industrial production, and other economic data, affects the demand for oil and, consequently, its price. Inventory levels: Reports on oil stockpiles, particularly those published by the American Petroleum Institute (API) and the Energy Information Administration (EIA), can influence prices based on whether they show a surplus or a deficit in supply. Currency fluctuations: Since oil is traded in U.S. dollars, movements in the value of the dollar can affect the price of oil in other currencies, influencing international demand. Given its importance in the global energy market, USOIL is a key commodity for traders looking to speculate on price movements or hedge against oil price volatility. However, trading USOIL can be risky and requires a solid understanding of the market forces at play, as well as careful risk management.

WTI

64.561

-0.037-0.06%
tradingkey.logo
tradingkey.logo
当社が提供する日中データはRefinitivより配信されており、同社の利用規約が適用されます。終値データ(過去・現在)についてもRefinitivより提供されています。全ての相場情報は現地取引所時間で表示されます。米国株式のリアルタイム最終取引価格はNasdaqを通じて報告された取引のみを反映しています。日中データは最低15分遅れ、または各取引所の要件に準じて遅延配信されます。
* 当コンテンツ(分析資料・取引戦略等)は第三者プロバイダーであるTrading Centralより提供されており、記載の見解は分析官の独立した評価及び判断に基づくものです。投資家個々の投資目的や財務状況は考慮されておりません。
リスク告知:当社ウェブサイト及びモバイルアプリは特定の投資商品に関する一般的な情報のみを提供しており、Finsightsは金融アドバイスや投資商品の推奨を行うものではありません。本情報の提供をもってFinsightsが投資助言を行っていると解釈されることはありません。
投資商品には元本割れを含む重大なリスクが伴い、全ての投資家に適するものではありません。なお、過去の運用実績は将来の成果を保証するものではありません。
Finsightsは、第三者広告主または提携先が当社ウェブサイト・モバイルアプリ上に広告を掲載することを許可する場合があり、これら広告主から広告への反応に基づく報酬を受けることがあります。
© 著作権: FINSIGHTS MEDIA PTE. LTD. 無断複写・転載を禁じます。
KeyAI