

Seagate Technology Holdings PLC
STXToday
-5.05%
5 Days
+0.73%
1 Month
+27.82%
6 Months
+267.34%
Year to Date
+277.22%
1 Year
+680.61%
TradingKey Stock Score of Seagate Technology Holdings PLC
Currency: USD Updated: 2026-06-23Key Insights
Seagate Technology Holdings PLC's fundamentals are relatively stable, and its growth potential is high.Its valuation is considered fairly valued, ranking 6 out of 34 in the Computers, Phones & Household Electronics industry.Institutional ownership is very high.Over the past month, multiple analysts have rated it as Buy, with the highest price target at 899.77.In the medium term, the stock price is expected to trend up.The company has been performing strongly in the stock market over the past month, which is supported by its strong fundamentals and technicals.The stock price is trading sideways between the support and resistance levels, making it suitable for range-bound swing trading.
Seagate Technology Holdings PLC's Score
Support & Resistance
Score Analysis
Media Coverage
Seagate Technology Holdings PLC Highlights
Analyst Rating
Seagate Technology Holdings PLC News
Micron Hits Another Record High, Rising Nearly 5% Ahead of Earnings, Poised to Break the $1,200 Mark
Micron continued to surge to a record high today, poised to break through the $1,200 mark ahead of its earnings release.

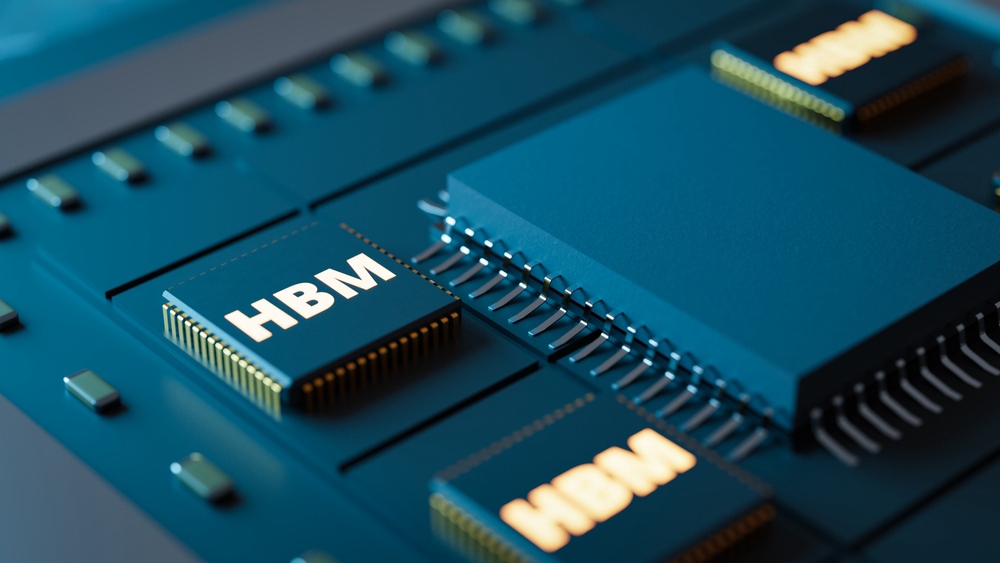
2026 Global Top Seven Storage Giants Ranking: Kioxia and SanDisk Lead Gains, Who Is Strongest in the AI Storage Supercycle?
TradingKey - Since the start of 2026, the Philadelphia Semiconductor Index (SOX) has surged by nearly 90%, with memory chips serving as the primary driving force. Against the backdrop of the index's upward trajectory, the market capitalizations of the DRAM "Big Three" have successively surpassed the $1 trillion mark. Meanwhile, two individual stocks in the NAND sector have surged over 45-fold over the past year, and hard disk drive (HDD) manufacturers have also undergone a valuation re-rating driven by AI data storage demand. So, which has been the strongest performer in this AI memory supercycle?
Surging Another 10% Pre-Market, Western Digital and Seagate Hit Record Highs Together as Morgan Stanley Warns HDD Shortage to Extend to 2028
TradingKey - During Tuesday's US pre-market trading session, Western Digital (WDC) shares surged 9.3% to $714, while Seagate Technology (STX) followed closely behind, rising 7.2% to $1,092. If this momentum continues into the regular trading session, both companies' stock prices will hit all-time highs.
US Pre-Market: US Stock Futures Edge Higher, Focus Shifts to Fed. SpaceX Rises Over 10%, Western Digital Gains Over 9%
TradingKey - On Tuesday EST, the three major U.S. stock index futures edged higher in pre-market trading as the market entered a wait-and-see stance following a sharp rally in the previous session. An interim agreement between the U.S. and Iran continued to weigh on oil prices, easing market concerns over energy inflation, but investor attention has clearly shifted to this week's Federal Reserve interest rate meeting. This marks the first interest rate decision since Kevin Warsh took office as Federal Reserve Chair, and the market will focus closely on his remarks regarding inflation, employment, and the subsequent path of interest rates.

[US Pre-Market] US-Iran Deal Ignites Risk Appetite. Three Major Futures Rise, AI Chip Stocks Rebound, SpaceX Rises Over 7%
TradingKey - On Monday ET, the three major U.S. stock index futures rose collectively in pre-market trading as market risk appetite significantly recovered. News of a temporary peace agreement between the U.S. and Iran and the potential reopening of the Strait of Hormuz has become the core variable for global markets today. Driven by easing geopolitical risks, international oil prices fell sharply, alleviating inflation concerns, while tech stocks, AI chip stocks, and airline stocks broadly strengthened. As of press time, Dow futures rose 0.91%, S&P 500 futures gained 1.31%, and Nasdaq 100 futures climbed 2.18%.
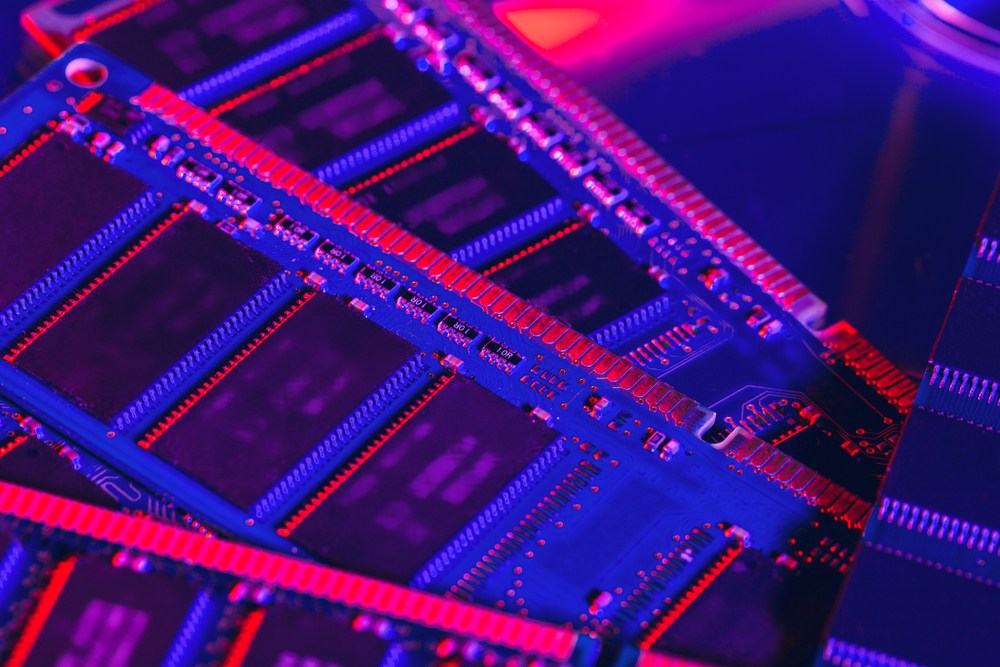
Micron, SanDisk Rebound Strongly. Morgan Stanley Reveals Truth of Nvidia Spec Cut, Jensen Huang Says Memory Demand Boom May Last Years.
Tradingkey — Last Friday, memory stocks plummeted following rumors that Nvidia plans to reduce memory configurations for its Vera Rubin racks. For details, see "Market Rumors: Nvidia Rubin Platform Plans to Reduce Memory Capacity…". The market interpreted the news of Nvidia (NVDA) cutting memory capacity for Vera Rubin racks as a sign of weakening memory demand. This triggered a 13.25% plunge in Micron and an 11.39% drop in SanDisk on the day, marking their largest single-day declines since the US-China trade war. However, Morgan Stanley’s latest research report refuted this bearish view, serving as the primary catalyst for today’s rally in memory stocks. As of press time, Micron Technology (MU) rose 9.11%, SanDisk (SNDK) gained 6.11%, and Seagate Technology (STX) advanced 4.%.
Financial Indicators
EPS
Total revenue
Seagate Technology Holdings PLC Info
Related Instruments
Popular Instruments
