

Rocket Lab USA Inc
RKLBToday
-3.99%
5 Days
-11.87%
1 Month
-29.08%
6 Months
+24.16%
Year to Date
+38.02%
1 Year
+220.52%
TradingKey Stock Score of Rocket Lab USA Inc
Currency: USD Updated: 2026-06-22Key Insights
Rocket Lab USA Inc's fundamentals are relatively very healthy, and its growth potential is high.Its valuation is considered fairly valued, ranking 30 out of 74 in the Aerospace & Defense industry.Institutional ownership is very high.Over the past month, multiple analysts have rated it as Buy, with the highest price target at 103.52.In the medium term, the stock price is expected to trend up.Despite a very weak market performance over the past month, the company shows strong fundamentals and technicals.The stock price is trading sideways between the support and resistance levels, making it suitable for range-bound swing trading.
Rocket Lab USA Inc's Score
Support & Resistance
Score Analysis
Media Coverage
Rocket Lab USA Inc Highlights
Analyst Rating
Rocket Lab USA Inc News
Rocket Lab Stock Forecast: Why June 22 Could Matter More Than the SpaceX IPO
TradingKey - Rocket Lab fell after the SpaceX IPO, but investors may be overlooking a larger catalyst. Nasdaq-100 inclusion on June 22 could bring fresh institutional demand as RKLB's backlog reaches a record $2.2 billion.
SpaceX Listing Triggers Siphon Effect. Space Stocks Crash Across the Board, Competitor Rocket Lab Plunges 13%
TradingKey - Upon the successful listing of SpaceX (SPCX), space concept stocks fell across the board, with competitor Rocket Lab (RKLB) tumbling as much as 13% at one point. Within the sector, Virgin Galactic (SPCE) plunged over 37%, Firefly Aerospace (FLY) dropped more than 20%, AST SpaceMobile (ASTS) fell over 16%, and Redwire (RDW) declined by more than 13%.
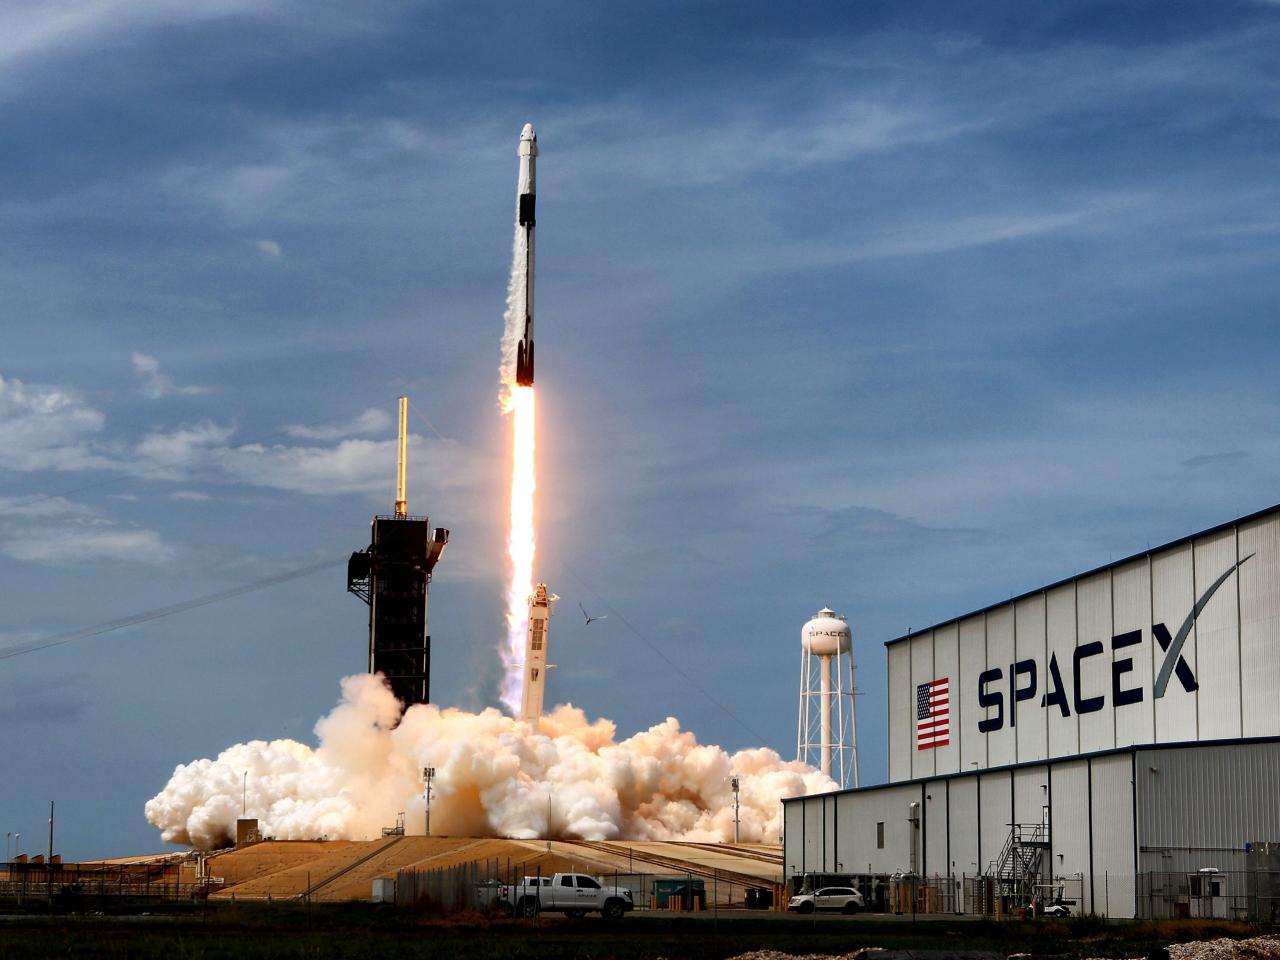
US Pre-Market: Three Major Indices Rise. SpaceX Listing Becomes Market Focus, Can It Lead Tech Stocks Higher?
TradingKey - On Friday ET, rising expectations of a U.S.-Iran peace agreement drove a sharp decline in oil prices, easing market concerns over energy inflation. Meanwhile, SpaceX’s (SPCX) largest-ever IPO debuted today, becoming the focus of pre-market trading. The three major U.S. stock index futures rose in pre-market sessions; as of press time, Dow futures were up approximately 0.8%, S&P 500 futures rose about 0.68%, and Nasdaq 100 futures gained roughly 0.64%.

Rocket Lab Has a $1.1 Billion Backlog, 50+ Successful Launches, and Neutron Due in 2026 — Is RKLB a Buy at $117?
TradingKey - Rocket Lab Q1 2026: $110M revenue, $1.1B backlog, 50+ Electron launches. Neutron medium-lift reusable rocket targeting 2026 first flight. RKLB at $117.40, 4H trendline support. Target $134.
Today’s Market Recap: Broadcom Plummets Over 12%, Weighing on the Chip Sector; Dow Hits New High Despite Market Trends; Bitcoin Approaches $61,000
TradingKey - Broadcom (AVGO) reported AI business earnings guidance that fell short of expectations, triggering a sell-off in tech and chip stocks as capital rotated into previously underperforming sectors such as healthcare and finance. Meanwhile, the Dow Jones Industrial Average bucked the trend t

SpaceX Epic IPO Approaches, Which Low Earth Orbit Satellite Concept Stocks Are Worth Watching?
TradingKey — According to people familiar with the matter, SpaceX plans to list on Nasdaq on June 12, 2026, under the ticker symbol SPCX. The company aims to raise $75 billion at a valuation of approximately $1.75 trillion to $2 trillion, which would mark the largest initial public offering (IPO) in history.

Financial Indicators
EPS
Total revenue
Rocket Lab USA Inc Info
Related Instruments
Popular Instruments
