

USAR
USARToday
-4.15%
5 Days
-10.60%
1 Month
-34.93%
6 Months
+60.92%
Year to Date
+60.92%
1 Year
+81.86%
USAR News
U.S. Rare Earth Stocks Are Enjoying a “Trump Dividend”
TradingKey - In February 2026, Donald Trump formally unveiled Project Vault, a broad strategic initiative aimed at rebuilding America’s control over rare‑earth supply chains.

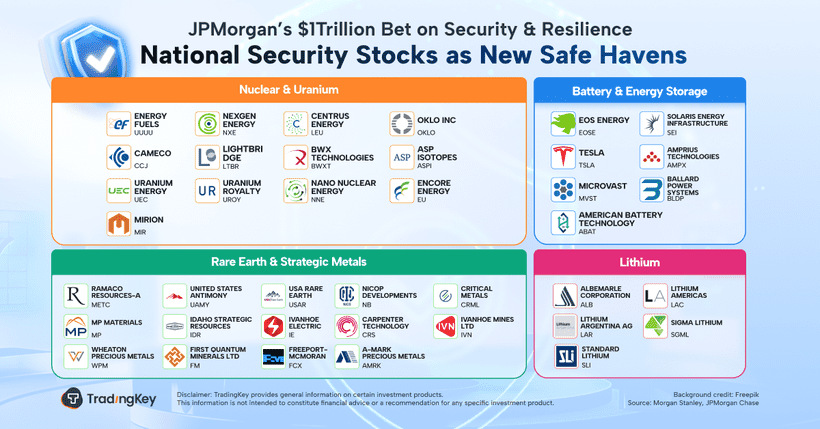
JPMorgan’s $1Trillion Bet on Security & Resilience: National Security Stocks as New Safe Havens
TradingKey - On Monday, JPMorgan announced a sweeping 10-year strategic investment plan under the theme of “Security & Resilience”—an initiative that could involve up to $1 trillion in capital deployment across four high-priority sectors.
Why Can't the U.S. Break Free from Its Dependence on Chinese Rare Earths? 4 Rare Earth Stocks to Watch
TradingKey - As the Trump 2.0 administration reignites global trade wars, China has demonstrated a firm stance that challenges U.S. political and economic ambitions. Behind China’s confidence lies a powerful card: its dominance in rare earth resources. China nearly monopolizes the global supply...
Popular Instruments