

Procter & Gamble Co
PGToday
-1.75%
5 Days
-1.80%
1 Month
+2.29%
6 Months
+3.55%
Year to Date
+3.10%
1 Year
-7.12%
TradingKey Stock Score of Procter & Gamble Co
Currency: USD Updated: 2026-06-22Key Insights
Procter & Gamble Co's fundamentals are relatively very healthy, and its growth potential is high.Its valuation is considered fairly valued, ranking 5 out of 35 in the Personal & Household Products & Services industry.Institutional ownership is very high.Over the past month, multiple analysts have rated it as Buy, with the highest price target at 163.61.In the medium term, the stock price is expected to remain stable.Despite an average stock market performance over the past month, the company shows strong fundamentals and technicals.The stock price is trading sideways between the support and resistance levels, making it suitable for range-bound swing trading.
Procter & Gamble Co's Score
Support & Resistance
Score Analysis
Media Coverage
Procter & Gamble Co Highlights
The Procter & Gamble Company is an American multinational consumer goods corporation based in Cincinnati, Ohio. Founded in 1837 by William Procter and James Gamble, it specializes in an extensive array of personal health and consumer health products, personal care, and hygiene items. These products are categorized into several segments, including beauty, grooming, health care, fabric and home care, as well as baby, feminine, and family care. Prior to the divestiture of Pringles and Duracell to Kellogg's and Berkshire Hathaway, respectively, its product lineup also encompassed food, snacks, beverages, and batteries. P&G is incorporated in Ohio.
In 2014, Procter & Gamble reported $83.1 billion in sales. On August 1, 2014, the company announced a strategic streamlining effort, resulting in the divestment of approximately 100 brands to concentrate on the remaining 65 brands, which accounted for 95% of its profits. A.G. Lafley, who served as chairman and CEO until October 2015, stated that the future P&G would be "a much simpler, much less complex organization of leading brands that's easier to manage and operate." In 2023, the company was placed 55th on the Forbes Global 2000 list.
Jon R. Moeller has been the chairman, president, and CEO of Procter & Gamble since 2021.
Analyst Rating
Procter & Gamble Co News
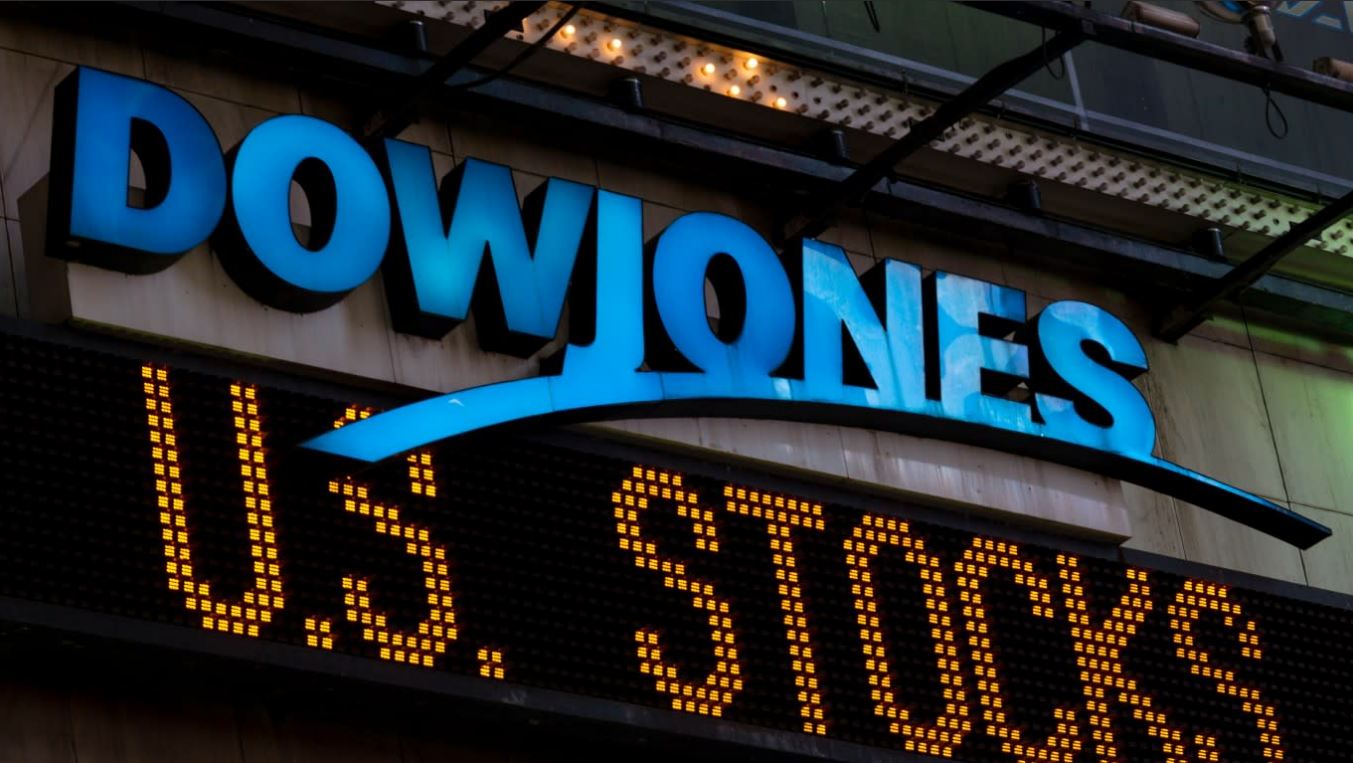
Dow Jones Hits Record High. AI Tech Theme Recedes, JPMorgan Expects Consumer Staples Stocks to Rebound
Tradingkey - On May 26, Eastern Time, the three major U.S. stock indices showed divergent performance. The Dow Jones Industrial Average hit an intraday record high of 50,830.41, while the Nasdaq Composite and the S&P 500 turned lower. Although U.S. equities have staged a strong broad-based rebound over the past two months, the performance gap between the three indices remains significant. The Nasdaq Composite has led the market with a cumulative gain of approximately 27%, followed by the S&P 500 with an 18% increase over the same period. The Dow Jones has shown relative weakness, rising only 12% during this interval and significantly lagging behind the other two major indices.
Amazon Opens ASCS, Another AWS? Logistics Business May Become New Growth Engine
TradingKey - Amazon (AMZN) recently announced that it is opening Amazon Supply Chain Services (ASCS) to all businesses, making its comprehensive freight, warehousing, fulfillment, and parcel delivery capabilities available to all types of enterprises, moving beyond serving only its own retail operations and platform sellers.
P&G First-Quarter Revenue Grows but Shares Open High and Close Low; What Is the Market Worried About?
TradingKey - On April 24 ET, consumer staples leader Procter & Gamble (PG) released its latest financial results. The report showed that while revenue increased, gross margins experienced a decline.
What Are Defensive Stocks? Best Defensive Stocks to Buy in 2026
TradingKey - Defensives run on resilience: predictable demand, strong cash flow, conservative balance sheets, and tame volatility. You can’t just look at a sector name to find them. It requires a systematic examination of cash generation, leverage, dividend sustainability, beta, competitive moats, a

Dow Jones Today: Navigating Market Trends and Investment Insights
As you navigate the intricate landscape of the financial markets in 2026, understanding the dynamics of the Dow Jones Industrial Average (DJIA) today, becomes paramount.
Financial Indicators
EPS
Total revenue
Procter & Gamble Co Info
The Procter & Gamble Company is an American multinational consumer goods corporation based in Cincinnati, Ohio. Founded in 1837 by William Procter and James Gamble, it specializes in an extensive array of personal health and consumer health products, personal care, and hygiene items. These products are categorized into several segments, including beauty, grooming, health care, fabric and home care, as well as baby, feminine, and family care. Prior to the divestiture of Pringles and Duracell to Kellogg's and Berkshire Hathaway, respectively, its product lineup also encompassed food, snacks, beverages, and batteries. P&G is incorporated in Ohio.
In 2014, Procter & Gamble reported $83.1 billion in sales. On August 1, 2014, the company announced a strategic streamlining effort, resulting in the divestment of approximately 100 brands to concentrate on the remaining 65 brands, which accounted for 95% of its profits. A.G. Lafley, who served as chairman and CEO until October 2015, stated that the future P&G would be "a much simpler, much less complex organization of leading brands that's easier to manage and operate." In 2023, the company was placed 55th on the Forbes Global 2000 list.
Jon R. Moeller has been the chairman, president, and CEO of Procter & Gamble since 2021.
Related Instruments
Popular Instruments
