tradingkey.logo
tradingkey.logo
Search

Goldman Sachs Group Inc

GS
Add to Watchlist
1094.140USD
-12.230-1.11%
Close 06/23, 16:00ETQuotes delayed by 15 min
322.87BMarket Cap
19.67P/E TTM

Goldman Sachs Group Inc

1094.140
-12.230-1.11%
View Detailed Chart
TradingKey 图表
Intraday
1m
30m
1h
D
W
M
D

Today

-1.11%

5 Days

+0.32%

1 Month

+9.77%

6 Months

+21.34%

Year to Date

+24.48%

1 Year

+69.14%

Key Figures
1077.170Open
1103.545High
2.07MVolume
19.67P/E TTM
16.62P/E Dynamic
17.000Dividend TTM
0.70%Turnover Ratio
1106.370Prev. Close
1069.000Low
1.18BTurnover
23.83P/E Static
2.95P/B
1.55%Div Yield TTM
0.94%ROA
1016.53552wk High
0.80Volume Ratio
13.53BNet Profit
294.57MShares
55.6252EPS TTM
1.28Beta
15.69%ROE
592.17052wk Low
3.12%Amplitude
46.27%Gross Margin
322.87BMarket Cap
7.04Reward/Risk
1.56%Risk Rate

Key Insights

Goldman Sachs Group Inc's fundamentals are relatively stable, and its growth potential is high.Its valuation is considered fairly valued, ranking 39 out of 122 in the Investment Banking & Investment Services industry.Institutional ownership is very high.Over the past month, multiple analysts have rated it as Hold, with the highest price target at 972.42.In the medium term, the stock price is expected to trend up.Despite a good stock market performance and strong technicals over the past month, the fundamentals don't support the current trend.The stock price is trading sideways between the support and resistance levels, making it suitable for range-bound swing trading.

Goldman Sachs Group Inc's Score

Industry at a Glance

Industry Ranking
39 / 122
Overall Ranking
169 / 4573
Industry
Investment Banking & Investment Services

Support & Resistance

Relevant data have not been disclosed by the company yet.

Score Analysis

Current score
Previous score

Media Coverage

Last 24 hours
Coverage Level

50°C

Very Low
Very High
Positive+

Goldman Sachs Group Inc Highlights

StrengthsRisks
The Goldman Sachs Group, Inc. is a global financial institution that delivers a range of financial services to a large and diversified client base that includes corporations, financial institutions, governments and individuals. Its segments include Global Banking & Markets, Asset & Wealth Management and Platform Solutions. The Global Banking & Markets segment offers a range of services, including financing, advisory services, risk distribution, and hedging for its institutional and corporate clients. It facilitates client transactions and makes markets in fixed income, equity, currency and commodity products. The Asset & Wealth Management segment manages assets and offers investment products across all asset classes to a diverse set of clients. It also provides investing and wealth advisory solutions. The Platform Solutions segment includes consumer platforms, such as partnerships offering credit cards and point-of-sale financing, and transaction banking and other platform businesses.
Industry Leader
The company's revenue leads the industry, with the latest annual revenue totaling USD 117.10B.
High Profit Growth
The company's net income leads the industry, with the latest annual income totaling USD 117.10B.
High Dividend
The company is a high dividend payer, with the latest dividend payout ratio of 28.10%.
Stable Dividend
The company has regularly paid dividends over the past 5 years, with the latest dividend payout ratio of 28.10%.
Overvalued
The company’s latest PB is 2.96, at a high 3-year percentile range.
Institutional Selling
The latest institutional holdings are 223.10M shares, decreasing 2.65% quarter-over-quarter.
Held by Tom Gayner
Star Investor Tom Gayner holds 305.09K shares of this stock.

Analyst Rating

Based on 24 analysts
Hold
Current Rating
972.421
Target Price
-12.11%
Upside Space
Data disclaimer: Analyst ratings and target prices are provided by LSEG for informational purposes only and do not constitute investment advice.

Goldman Sachs Group Inc News

Goldman Says ‘No Bubble Yet,’ Citi Calls for S&P 8100: How Two Major Investment Banks Interpret the AI-Driven U.S. Stock Rally?

TradingKey - As the AI wave continues to drive U.S. equities higher, debates over whether valuations have reached unsustainable levels are intensifying. Goldman Sachs (GS) noted in its latest research report that although some signs of overheating are emerging, key indicators show a significant gap between current market levels and the extremes seen during historical bubble periods. Meanwhile, Citigroup (C) has sharply raised its year-end 2026 S&P 500 target to 8,100, citing an "unprecedented" AI capex super-cycle.

TradingKeyMon, Jun 8
TradingKey - As the AI wave continues to drive U.S. equities higher, debates over whether valuations have reached unsustainable levels are intensifying. Goldman Sachs (GS) noted in its latest research report that although some signs of overheating are emerging, key indicators show a significant gap between current market levels and the extremes seen during historical bubble periods. Meanwhile, Citigroup (C) has sharply raised its year-end 2026 S&P 500 target to 8,100, citing an "unprecedented" AI capex super-cycle.

Goldman Sachs Expected to Lead SpaceX IPO Underwriting, Morgan Stanley to Follow

TradingKey — Goldman Sachs (GS) is expected to serve as the lead underwriter for SpaceX’s IPO, ranking first on the underwriter list, according to people familiar with the matter. Morgan Stanley (MS) is also a lead underwriter for the IPO but is expected to rank behind Goldman Sachs.

TradingKeyWed, May 20
TradingKey — Goldman Sachs (GS) is expected to serve as the lead underwriter for SpaceX’s IPO, ranking first on the underwriter list, according to people familiar with the matter. Morgan Stanley (MS) is also a lead underwriter for the IPO but is expected to rank behind Goldman Sachs.

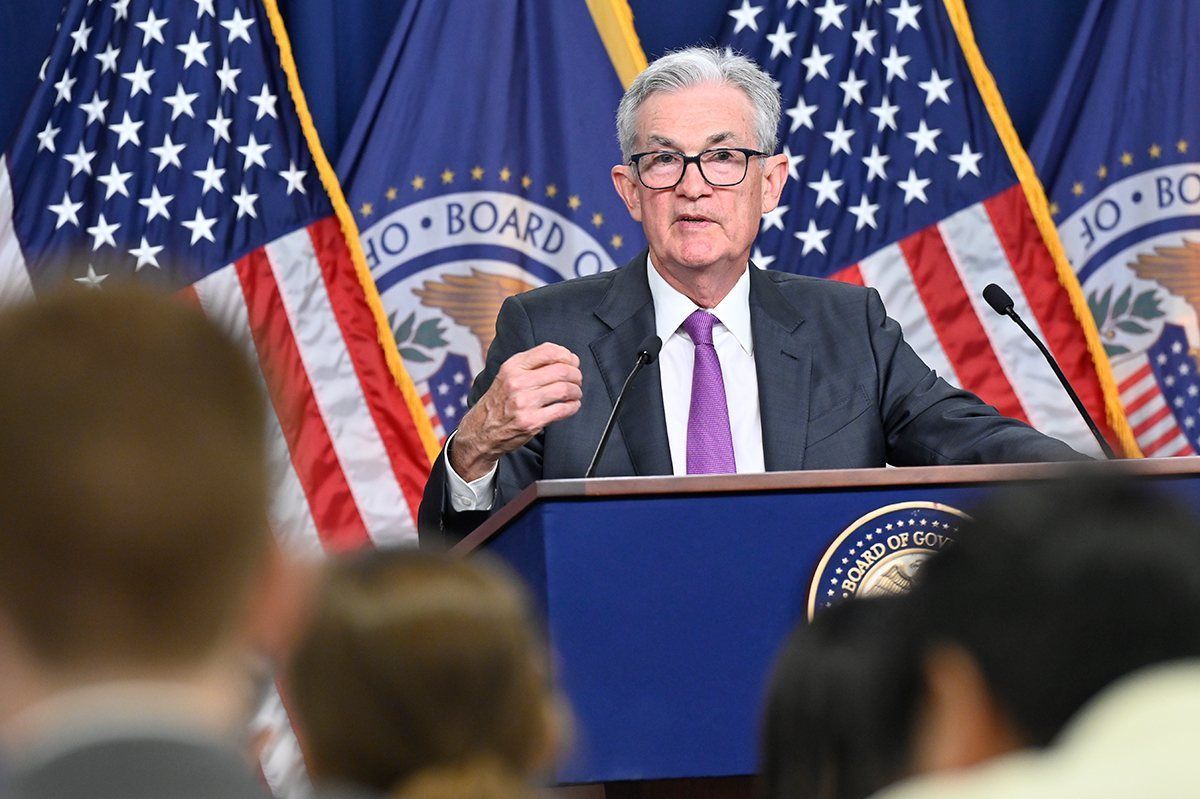
Fed Keeps Rates Unchanged, How Powell’s Remarks Affect US Stocks, Dollar and Gold?

TradingKey - The Federal Reserve kept interest rates unchanged, and coupled with Powell's cautious remarks, the US dollar remained supported and continued to rise. US stocks may face pressure, while gold (XAUUSD) came under short-term pressure, briefly dipping to $4518.73. However, it failed to break below the $4500 mark, indicating that market selling pressure has been absorbed.

TradingKeyThu, Apr 30
TradingKey - The Federal Reserve kept interest rates unchanged, and coupled with Powell's cautious remarks, the US dollar remained supported and continued to rise. US stocks may face pressure, while gold (XAUUSD) came under short-term pressure, briefly dipping to $4518.73. However, it failed to break below the $4500 mark, indicating that market selling pressure has been absorbed.

Goldman Sachs: Structurally Bullish on Gold to $5,400, But Warns of Short-Term Pullback

TradingKey — Goldman Sachs' (GS) latest precious metals research report presents a dual-track outlook of "structurally bullish but tactically cautious" for gold (XAUUSD). The bank maintains its year-end gold price target of $5,400/oz while warning that short-term downside risks warrant vigilance.

TradingKeyWed, Apr 29
TradingKey — Goldman Sachs' (GS) latest precious metals research report presents a dual-track outlook of "structurally bullish but tactically cautious" for gold (XAUUSD). The bank maintains its year-end gold price target of $5,400/oz while warning that short-term downside risks warrant vigilance.

US Pre-Market: Oil Prices Surge 8% Hitting US Stocks, Goldman’s Strong Earnings Still Fail to Stop Bank Stock Slide

Strait of Hormuz Blockade Triggers 8% Oil Price Surge: U.S. Index Futures Plunge and Bank Stocks Decline Amid Global Wave of Risk Aversion

TradingKeyMon, Apr 13
Strait of Hormuz Blockade Triggers 8% Oil Price Surge: U.S. Index Futures Plunge and Bank Stocks Decline Amid Global Wave of Risk Aversion

Goldman Sachs Q1 Earnings Preview: Strong Fundamentals Meet 'Wall of Worry'

TradingKey - April 13, 2026. Goldman Sachs (GS) will lead the charge, kicking off the first-quarter earnings season for Wall Street’s major banks. Amidst the dual impact of the pessimistic "AI disrupts everything" narrative and the continued escalation of private credit risks, this earnings report not only impacts Goldman’s own valuation but is also regarded by the market as a crucial bellwether for whether the broader financial sector can climb the "wall of worry."

TradingKeyMon, Apr 13
TradingKey - April 13, 2026. Goldman Sachs (GS) will lead the charge, kicking off the first-quarter earnings season for Wall Street’s major banks. Amidst the dual impact of the pessimistic "AI disrupts everything" narrative and the continued escalation of private credit risks, this earnings report not only impacts Goldman’s own valuation but is also regarded by the market as a crucial bellwether for whether the broader financial sector can climb the "wall of worry."

Financial Indicators

EPS

Relevant data have not been disclosed by the company yet.

Total revenue

Relevant data have not been disclosed by the company yet.

Goldman Sachs Group Inc Info

The Goldman Sachs Group, Inc. is a global financial institution that delivers a range of financial services to a large and diversified client base that includes corporations, financial institutions, governments and individuals. Its segments include Global Banking & Markets, Asset & Wealth Management and Platform Solutions. The Global Banking & Markets segment offers a range of services, including financing, advisory services, risk distribution, and hedging for its institutional and corporate clients. It facilitates client transactions and makes markets in fixed income, equity, currency and commodity products. The Asset & Wealth Management segment manages assets and offers investment products across all asset classes to a diverse set of clients. It also provides investing and wealth advisory solutions. The Platform Solutions segment includes consumer platforms, such as partnerships offering credit cards and point-of-sale financing, and transaction banking and other platform businesses.
Ticker SymbolGS
CompanyGoldman Sachs Group Inc
CEOSolomon (David M)
Websitehttps://www.goldmansachs.com/

FAQs

What is the current price of Goldman Sachs Group Inc (GS)?

The current price of Goldman Sachs Group Inc (GS) is 1094.14.

What is the symbol of Goldman Sachs Group Inc?

The ticker symbol of Goldman Sachs Group Inc is GS.

What is the 52-week high of Goldman Sachs Group Inc?

The 52-week high of Goldman Sachs Group Inc is 1016.53.

What is the 52-week low of Goldman Sachs Group Inc?

The 52-week low of Goldman Sachs Group Inc is 592.17.

What is the market capitalization of Goldman Sachs Group Inc?

The market capitalization of Goldman Sachs Group Inc is 322.87B.

Is Goldman Sachs Group Inc (GS) currently rated as Buy, Hold, or Sell?

According to analysts, Goldman Sachs Group Inc (GS) has an overall rating of signal_hold, with a price target of 972.42.

What is the Earnings Per Share (EPS TTM) of Goldman Sachs Group Inc (GS)?

The Earnings Per Share (EPS TTM) of Goldman Sachs Group Inc (GS) is 52.13.
KeyAI