

Draftkings Inc
DKNGToday
+11.26%
5 Days
-2.61%
1 Month
+4.77%
6 Months
-26.32%
Year to Date
-25.42%
1 Year
-40.08%
TradingKey Stock Score of Draftkings Inc
Currency: USD Updated: 2026-06-26Key Insights
Draftkings Inc's fundamentals are relatively very healthy, and its growth potential is high.Its valuation is considered fairly valued, ranking 63 out of 119 in the Hotels & Entertainment Services industry.Institutional ownership is very high.Over the past month, multiple analysts have rated it as Buy, with the highest price target at 34.69.In the medium term, the stock price is expected to trend up.Despite an average stock market performance over the past month, the company shows strong fundamentals and technicals.The stock price is trading sideways between the support and resistance levels, making it suitable for range-bound swing trading.
Draftkings Inc's Score
Support & Resistance
Score Analysis
Media Coverage
Draftkings Inc Highlights
Analyst Rating
Draftkings Inc News
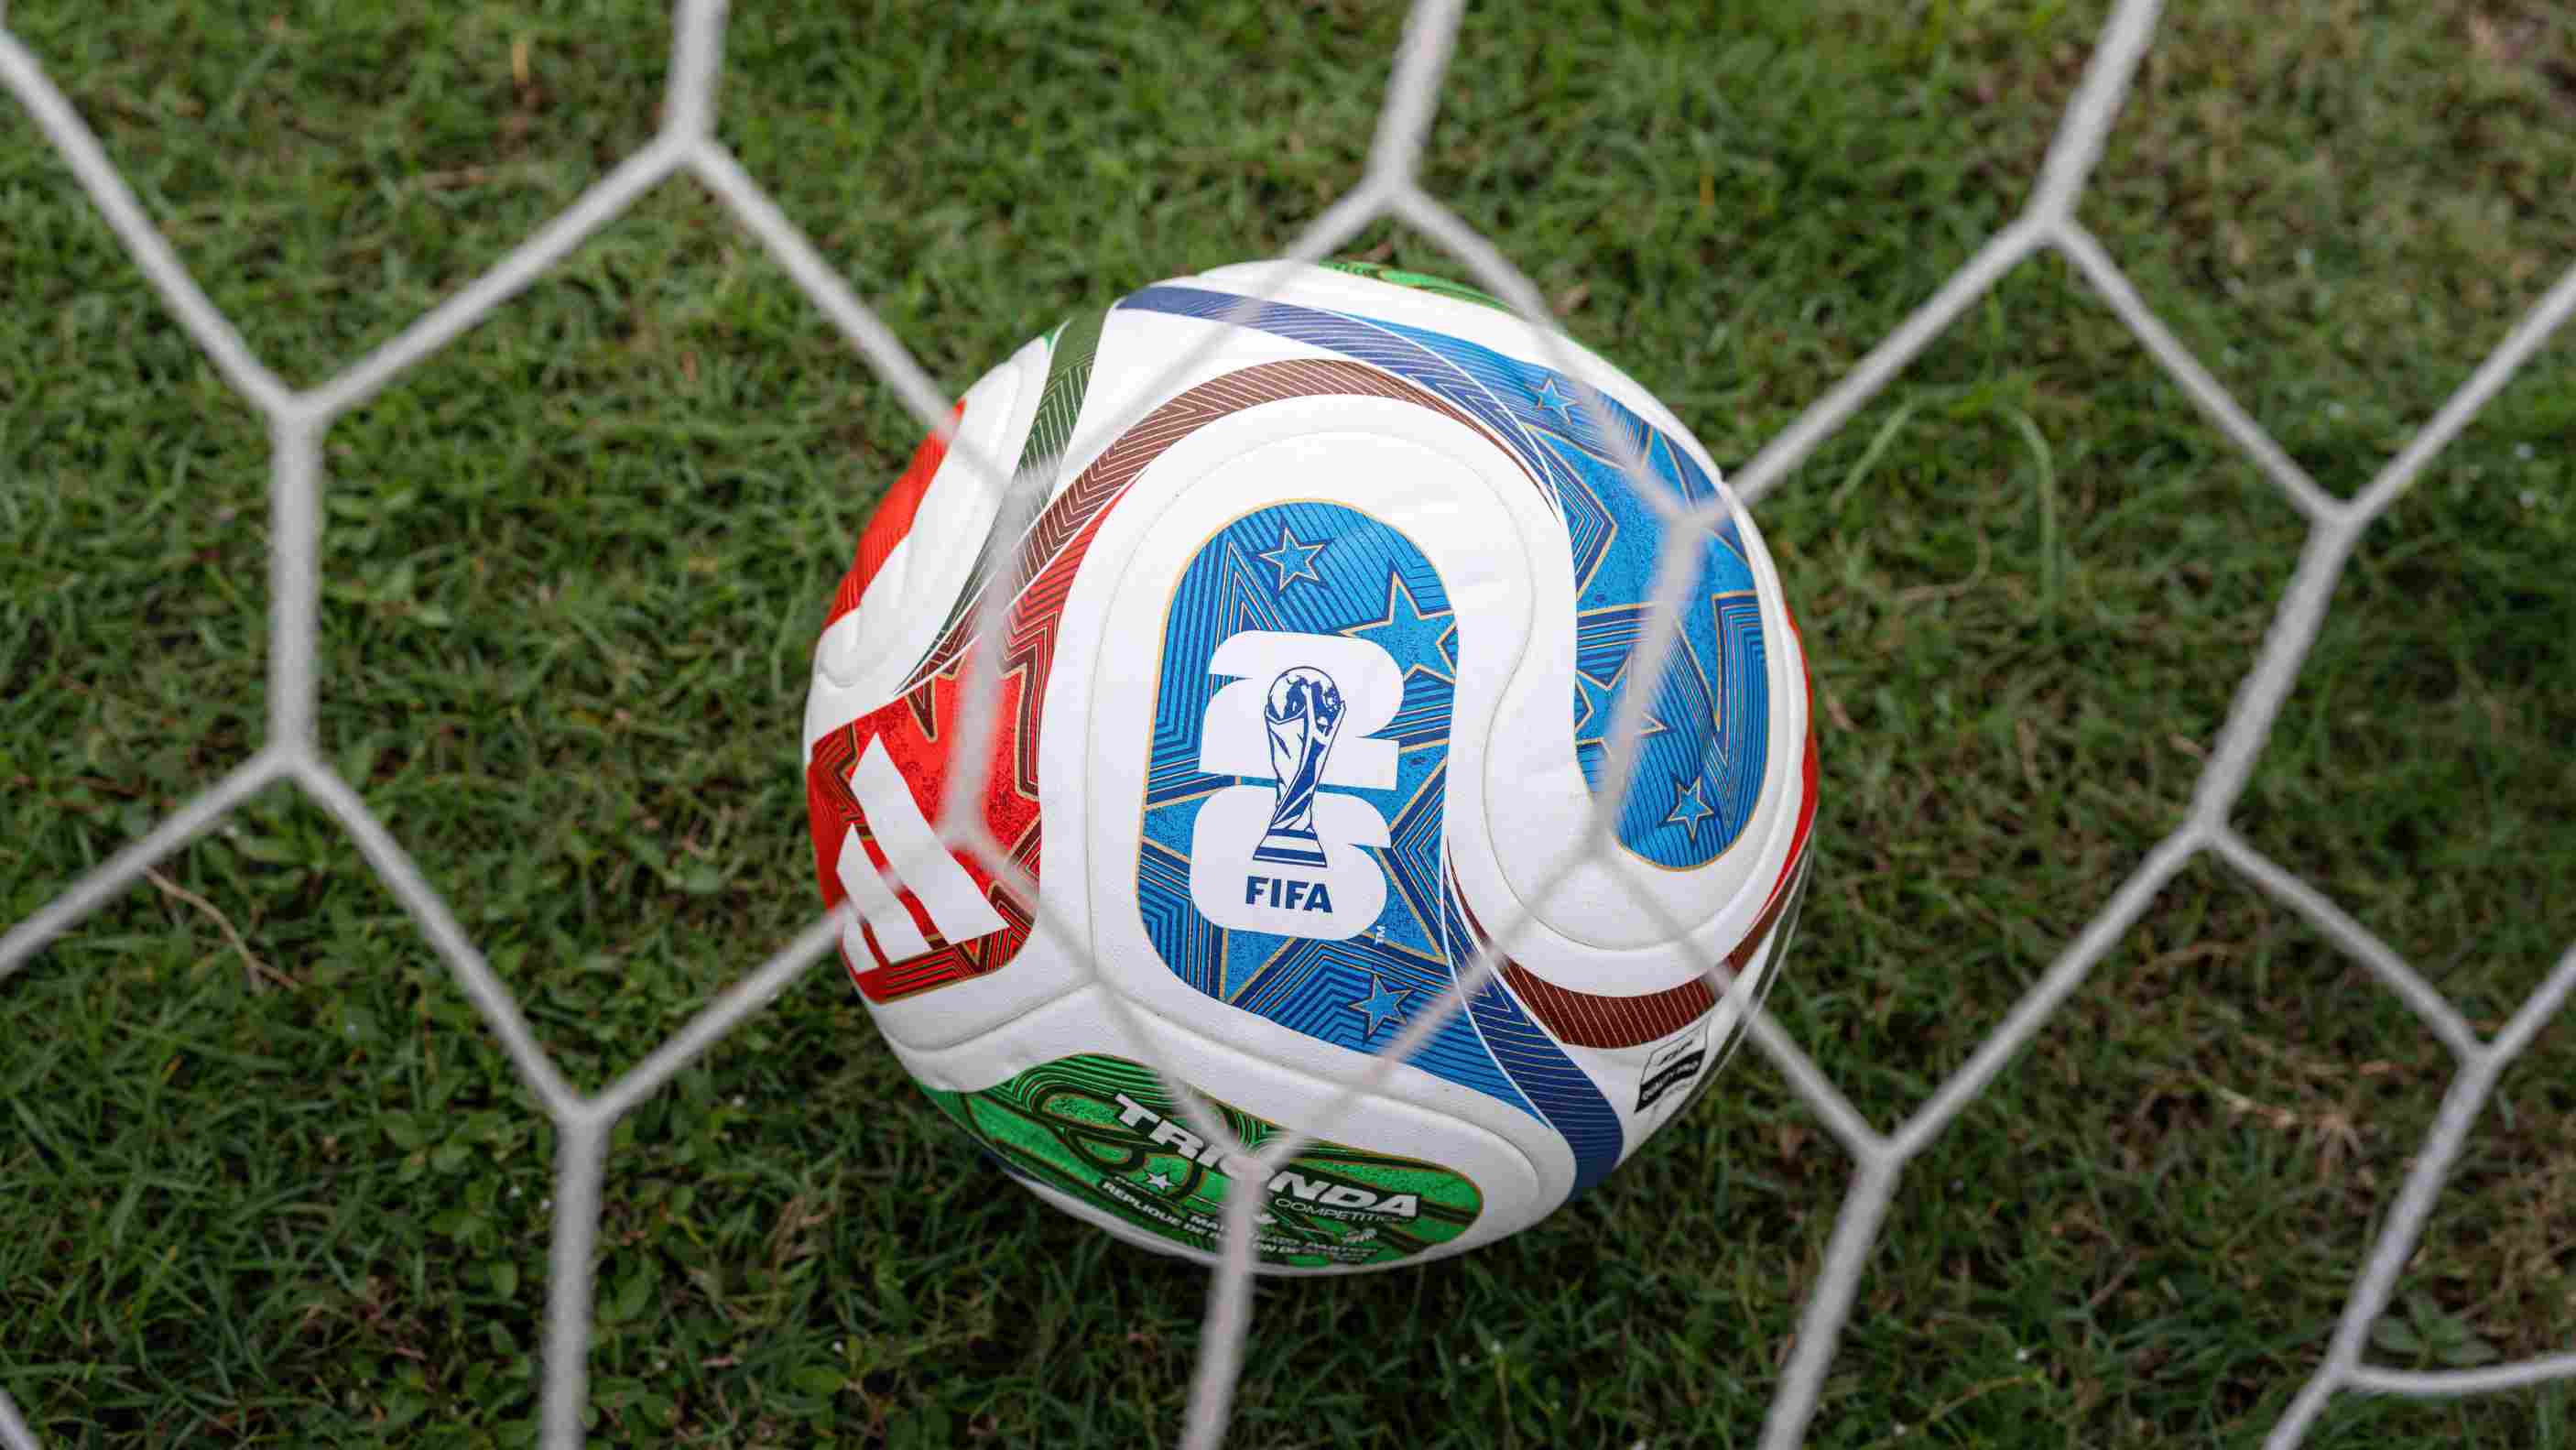
2026 World Cup in US, Canada, Mexico Starts. Which Industry Stocks Are Expected to Benefit?
Tradingkey - The opening match of the 2026 FIFA World Cup will officially kick off on June 11, with the tournament running until July 19 across 16 cities in the United States, Canada, and Mexico. Investment banks Deutsche Bank and Goldman Sachs noted that the World Cup will serve as a major catalyst for various consumer, media, and betting stocks, particularly generating clear incremental earnings growth in sectors such as tourism, catering, and sports betting.

There Are Other Investment Opportunities Besides AI Stocks. World Cup Approach Catalyzes Gambling Stock Gains, MGM Rises Over 14%
Tradingkey - On June 1, the three major US stock indices closed mixed as sector-level divergence further intensified. NVIDIA CEO Jensen Huang announced at the GTC conference that the company's next-generation AI computing platform, Vera Rubin, has entered full-scale mass production. This news furthe
Financial Indicators
EPS
Total revenue
Draftkings Inc Info
Related Instruments
Popular Instruments
