

Albemarle Corp
ALBToday
-4.30%
5 Days
-11.22%
1 Month
-12.61%
6 Months
+2.22%
Year to Date
+6.02%
1 Year
+164.65%
TradingKey Stock Score of Albemarle Corp
Currency: USD Updated: 2026-06-22Key Insights
Albemarle Corp's fundamentals are relatively very healthy, and its growth potential is high.Its valuation is considered fairly valued, ranking 22 out of 68 in the Chemicals industry.Institutional ownership is very high.Over the past month, multiple analysts have rated it as Buy, with the highest price target at 217.12.In the medium term, the stock price is expected to trend down.Despite a weak stock market performance over the past month, the company shows strong fundamentals and technicals.The stock price is trading sideways between the support and resistance levels, making it suitable for range-bound swing trading.
Albemarle Corp's Score
Support & Resistance
Score Analysis
Media Coverage
Albemarle Corp Highlights
Analyst Rating
Albemarle Corp News
Albemarle Q1 Net Income Surges 672%. Recovery in Lithium Mining Industry Prosperity Boosts Company Performance.
TradingKey - Lithium giant Albemarle released its first-quarter 2026 financial results during the U.S. after-market session. As the world’s largest lithium producer, the company’s operating performance is regarded not only as its own financial data but also as a leading indicator for the entire industry. During the period, Albemarle recorded sales of $1.429 billion, up 33% year-on-year, slightly above average market expectations. Adjusted EBITDA reached $664 million, a 148% increase from $267 million in the same period last year, significantly exceeding the market forecast of $468 million.
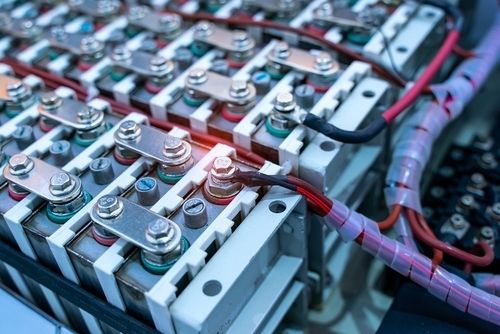
Overnight US Lithium Stocks Lead Gains; Lithium Sector Operating Logic Sees Transition of Old and New as Geopolitical Conflict May Raise Sector Pivot Again?
TradingKey - Overnight, U.S. lithium mining stocks were among the top gainers. Sigma Lithium (SGML) led the sector, closing up 17.1%; Lithium Americas (LAC) rose 7.62%; Albemarle (ALB) climbed 6.79%; and SQM closed 6.71% higher. Looking back at the past year, the lithium battery sector has maintained a sustained rally. Albemarle (ALB) surged from its post-U.S.-China trade war low of $48.57 to a high of $205 this year. The key driver behind this move was better-than-expected energy storage demand triggered by the rise in AI computing power requirements. During this period, lithium carbonate futures rebounded from a mid-year low of 59,000 RMB/ton to the 150,000 RMB/ton level. However, judging by recent performance, the sector appears to have shifted from its previous unilateral upward trend toward a period of range-bound volatility.
Financial Indicators
EPS
Total revenue
Albemarle Corp Info
Related Instruments
Popular Instruments
