

XAUG
XAUGToday
0.00%
5 Days
-0.26%
1 Month
+0.18%
6 Months
+3.79%
Year to Date
+3.99%
1 Year
+9.22%
XAUG News
International Copper Prices Rise for 7 Straight Months; Will Bull Market Continue in 2026?
TradingKey - As the "king of industrial metals," every fluctuation in international copper prices impacts the nerves of global investors. In early 2026, international copper prices continued to rise, extending the upward trend from 2025 and reaching a new high above $14,500, marking seven consecutive months of gains. Meanwhile, London Metal Exchange (LME) copper prices have climbed from $7,800 per tonne in July 2025 to over $9,000 per tonne today.

Week Ahead: What Signals Will Fed Minutes Send? US December Core PCE Due
TradingKey - As the U.S. Q4 earnings season draws to a close, a steady rise in market participation has pushed the U.S. stock market into a "new normal" of $1 trillion in average daily trading volume. This week, investors should focus on the U.S. Core PCE Price Index for December; inflation levels remain elevated relative to the Federal Reserve's target. Additionally, attention will be on the Federal Reserve’s monetary policy meeting minutes, as investors search for further policy signals.
USD Dollar Trend Forecast: Dollar Index Falls Below 97.0 to 4-Year Low, Will the Dollar Continue To Fall or Bottom Out in 2026?
TradingKey - In January 2026, the US Dollar Index continued its downward trend from 2025, officially breaking below the key 97.0 level and reaching a low of 95.5, marking a nearly four-year low since February 2022.

Gold Nears $5,600 To Hit New Record High as Fed Dovishness and Middle East Tensions Mount; Is $6,000 Not a Dream?
TradingKey - Global financial markets are being swept by a double storm. On one side, spot gold is staging a "mad bull" rally, briefly surging past $5,500/oz and approaching a record high of $5,600. Yet, the enthusiasm of safe-haven capital remains unabated. As the Federal Reserve’s "Super Week" con
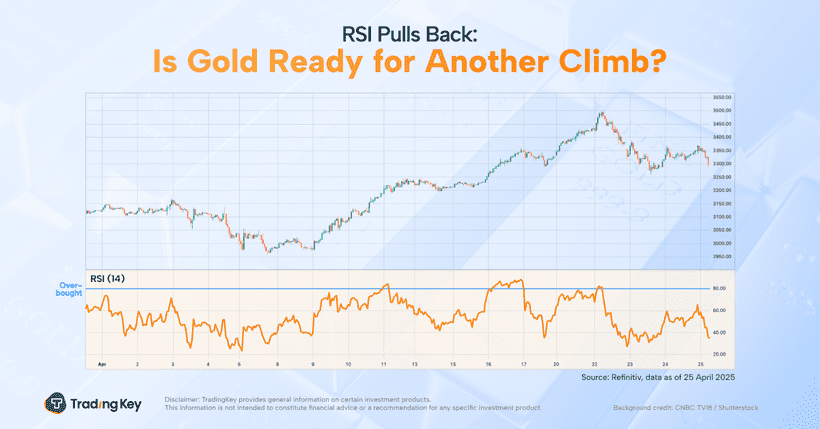
Gold Pulls Back from Record Highs: Is It Time to Buy?
TradingKey - According to Bespoke Research, gold prices have set a new 52-week high 24 times over the past three months, with another record high reached on Tuesday.
Popular Instruments
