

데이터 없음
검색
주식 시세
주식 시세는 지수, 섹터 및 관련 미국 주식 거래 종목을 포함한 미국 시장 데이터를 집중적으로 제공합니다.
52208.900-1.30%
7429.000-0.96%
28770.900-1.42%
분포
최신
내역
부문
더 보기
에너지 - 화석 연료
+2.94%Battalion Oil Corp+25.00%
EON Resources Inc+10.17%
MV Oil Trust+8.63%
학술 및 교육 서비스
+2.26%Jianzhi Education Technology Group Co Ltd+10.44%
Mynd.ai Inc+4.75%
Adtalem Global Education Ord Shs+4.57%
개인 및 가정용 제품 및 서비스
+1.79%Beauty Health Co+45.71%
AXIL Brands Inc+10.02%
E-Home Household Service Holdings Ltd+3.77%
부동산
+1.68%Empire State Realty OP LP+6.27%
Medalist Diversified Reit Inc+4.45%
Power REIT+4.23%
제약 및 의료 연구
+1.64%Crinetics Pharmaceuticals Inc+98.74%
Tvardi Therapeutics Ord Shs+53.98%
Akari Therapeutics PLC+42.02%
소프트웨어 및 IT 서비스
+1.35%Trident Digital Tech Holdings Ltd+39.56%
Snail Inc+18.73%
Versus Systems Inc+14.71%
주식 목록
번호
이름
가격
변동
Chg %
총 점수
시간
거래량
매출
시가총액
주식
변동 폭
거래량 비율
52주 최고가
52주 최저가
배당금
배당 수익률
5D
10D
20D
60D
120D
250D
연초 대비
관심 목록
주식 분석
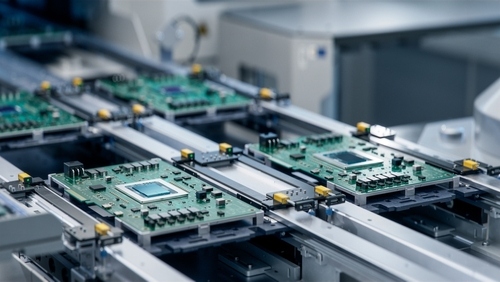
반도체 인재 부족 심화: 마이크론, 삼성, TSMC의 미국 공장 증설 타격 입을까?
TradingKey - 맥킨지(McKinsey & Company), 미국 반도체산업협회(SEMI), 국립과학재단(National Science Foundation)이 공동으로 진행한 고용주 설문조사 분석에 따르면, 미국 반도체 산업의 기술 인력 부족 규모가 2030년까지 전지적 정규직 직원(full-time employees) 기준 최대 157,000명에 달할 것으로 전망된다.
TradingKey11 minutes ago
세미어널리시스(SemiAnalysis) 최신 보고서: 앤트로픽(Anthropic)의 3분기 매출 10억 달러 상회 가능성
TradingKey - 리서치 기업 세미안analysis(SemiAnalysis)가 최근 발표한 심층 보고서에 따르면, AI 거대모델 기업 앤스로픽(Anthropic)은 2026년 3분기까지 GAAP EBIT(일반회계기준 이자 및 법인세 차감전이익) 10억 달러 이상을 달성할 것으로 예상된다. 또한 연간 반복매출(ARR)은 2025년 말 90억 달러에서 600억 달러 이상으로 급증할 전망이다. 세미안analysis는 앤스로픽이 현재의 전략을 지속적으로 효율적으로 실행한다면, 사상 최초로 시가총액 6조 달러에 도달하는 기업이 될 잠재력이 있다고 분석했다.
TradingKey16 minutes ago

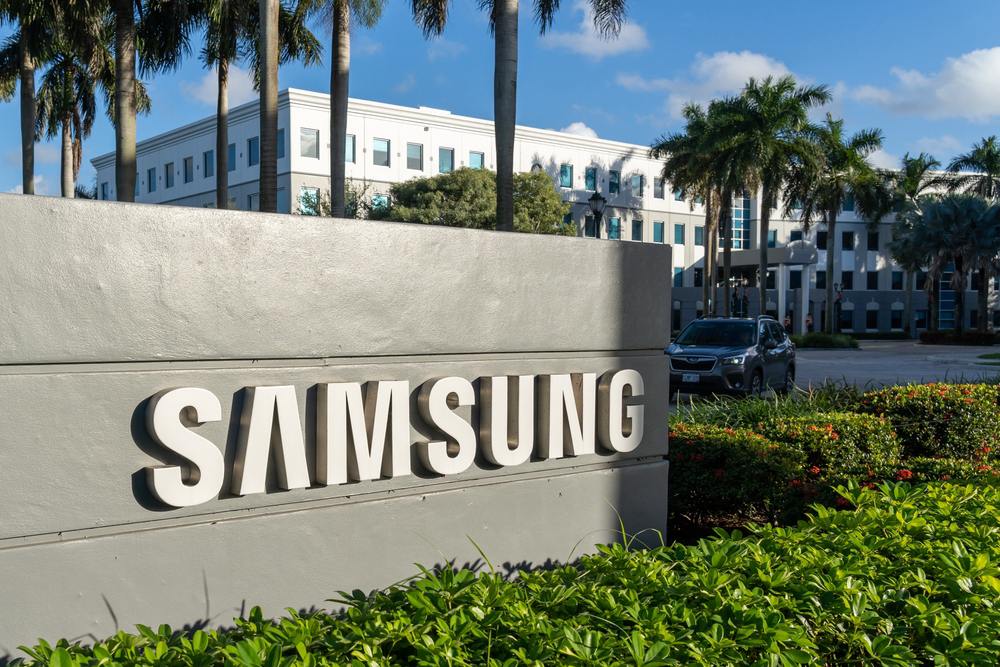
삼성전자 주가 전망: 이틀 연속 10% 이상 폭락, 20% 가까운 단기 조정 직면할 수도
TradingKey - 7월 8일 아시아 거래 세션 중 삼성전자 주가는 한때 1% 상승에서 7% 이상 폭락으로 반전하며 최저 273,500원까지 떨어진 후, 결국 6.25% 하락한 277,500원에 마감했다. 삼성전자는 어제 지난해 같은 기간을 크게 상회하는 2분기 실적 가이던스를 발표했으나, 주가는 긍정적인 실적 모멘텀을 이어가지 못했다. 오히려 2거래일 연속 급락하며 누적 하락률이 14%에 육박했다.
TradingKeyan hour ago
600억 달러 규모의 인수 후 첫 공개. SpaceX와 Cursor 공동 AI 모델 수요일 출시 예정, OpenAI 및 Anthropic에 도전장
TradingKey - 디 인포메이션(The Information)이 인용한 소식통에 따르면, 스페이스X(SpaceX)의 인공지능 부문인 스페이스XAI(SpaceXAI)와 프로그래밍 도구 기업 커서(Cursor)가 이르면 이번 수요일 양사가 공동 개발한 최초의 AI 모델을 출시할 계획이다.
TradingKey2 hours ago
일한 증시 폭락: 삼성전자와 SK하이닉스 6% 하락하며 하락세 주도, 소프트뱅크와 키옥시아는 소폭 하락
일본과 한국 증시가 일제히 하락한 가운데, 코스피 지수는 5% 이상 폭락했고 닛케이 225 지수는 2% 넘게 떨어졌다. 삼성전자와 SK하이닉스는 약 6% 급락했으며, 소프트뱅크와 키옥시아는 소폭 하락세를 기록했다.
TradingKey2 hours ago

SpaceX, AI 시대의 글로벌 통신 기반 구축 위해 100,000개의 Gen3 위성 발사 신청
TradingKey - 미국 연방통신위원회(FCC)의 공시에 따르면, 스페이스X는 AI 시대의 글로벌 통신 인프라 구축을 목표로 100,000개의 위성으로 구성된 3세대(Gen3) 군집위성을 발사 및 운영하기 위한 승인 신청서를 이번 주 FCC에 제출했다.
TradingKey3 hours ago

TradingKey 스마트픽

TK-강화형 콜린 맥린 성장 & 가치 퀀트 전략
스마트 알고리즘을 통해 펀더멘털과 시장 행동을 결합한 이 접근 방식은, 동적인 다중 주파수 신호를 활용하여 현대 시장에서 가치 투자 전략의 알파를 극대화합니다.
보유 지분 변동


하워드 로스만의 신중한 자산 전략
상승장과 하락장에 유연하게 대응하는 스마트한 정량적 기법으로, 안정적인 성장과 정밀한 리스크 관리를 완벽하게 조화시킵니다.
보유 지분 변동


데이비드 폴렌(David Polen)의 합리적 성장 전략
이 전략은 데이비드 폴렌의 우수한 현금 흐름을 가진 기업을 장기 보유한다는 투자 철학을 이어가며, 동시에 내재적 수익률 평가 모델을 도입하였습니다. 이 전략은 정량적 방법을 통해 비용 가격 대비 균형 잡힌 성장을 추구하며, 무분별한 고가 추종을 피하고 각 보유 종목이 합리적인 기대 수익을 갖도록 보장합니다.
보유 지분 변동


마이클 J. 카(Michael J. Carr)의 저이익 성장 전략
이 전략은 마이클 J. 카가 제안한 "수익형 투자" 프레임워크를 기반으로 합니다. 이 전략의 원칙은 시장의 상승과 하락을 예측하는 것이 아니라, 시장의 현재 위험 상태를 판단하여 위험을 감수할지 여부 및 그 방법을 결정하는 데 있습니다.
보유 지분 변동


진행 예정 이벤트
재무제표
배당금
주식 분할
기업 공개
2026-07-08
장후 거래
AZZ Inc
AZZ
주당순이익 예상1.69
실제 EPS--
수익 예상434.52M
수익 실제--
2026-07-08
장후 거래
PriceSmart Inc
PSMT
주당순이익 예상1.19
실제 EPS--
수익 예상1.43B
수익 실제--
2026-07-08
장후 거래
Levi Strauss & Co
LEVI
주당순이익 예상0.24
실제 EPS--
수익 예상1.52B
수익 실제--
2026-07-08
장전 거래
Helen of Troy Ltd
HELE
주당순이익 예상-0.01
실제 EPS--
수익 예상374.55M
수익 실제--
시장 히트맵
주식
부문