

Keine Daten
Suchen
Aktien Marktkurse
Aktienkurse konzentrieren sich auf die Marktdaten der USA, einschließlich Indizes, Sektoren und verwandten US-Aktieninstrumenten.
52657.400+0.44%
7543.000+0.07%
29592.700-0.39%
Verteilung
Neueste
Geschichte
Sektor
Mehr Anzeigen
Industrie- und Gewerbeservices
+4.12%Willis Lease Finance Corp+17.61%
Professional Diversity Network Inc+8.93%
OneConstruction Group Ltd+7.89%
Technologie-Hardware
+3.24%SAIHEAT Ltd+8.60%
Integrated Media Technology Ltd+7.79%
Taoping Inc+7.19%
Rohstoffressourcen
+2.11%Ampco-Pittsburgh Corp+9.55%
Scully Royalty Ltd+9.52%
Galiano Gold Inc+7.90%
Automobile & Autoteile
+2.09%StableX Technologies Ord Shs+5.71%
GreenPower Motor Company Inc+4.23%
Massimo Group+3.67%
Erneuerbare Energien
+1.78%Zeo Energy Corp+6.88%
XCF Global Ord Shs Class A+4.51%
Fusion Fuel Green PLC+2.33%
Software und IT-Dienstleistungen
+1.74%Global Mofy AI Ltd+171.35%
CCC Intelligent Solutions Holdings Ord Shs+9.67%
VIDA.NB+9.17%
Aktienliste
Nr.
Name
Kurs
Veränderung
Änderung%
Gesamtpunktzahl
Zeit
Volumen
Umsatz
Marktkapitalisierung
Aktien
Preisspanne
Volumen %
52-Wochen-Hoch
52-Wochen-Tief
Dividende
Dividendenrendite
5T
10T
20T
60T
120T
250T
Seit Jahresbeginn
Beobachtungsliste
Aktienanalyse
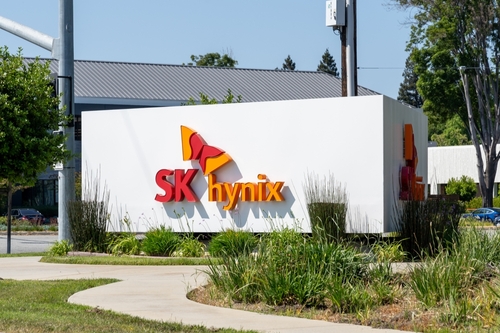
Erster Handelstag der ADRs des Speichergiganten SK Hynix: Worauf sollten US-Aktieninvestoren achten?
TradingKey – Am 10. Juli (US-Ostküstenzeit) wird SK Hynix (SKHY) offiziell an der Nasdaq gelistet, zu einem Preis von 149 $ pro ADR. Mit einem Emissionsvolumen von rund 26,5 Mrd. $ übertrifft das Angebot den Rekord von Alibaba aus dem Jahr 2014 in Höhe von 25 Mrd. $ und wird damit zum größten US-Börsengang eines ausländischen Unternehmens.
TradingKey27 minutes ago

Rekordsumme von 26,5 Milliarden eingeworben: SK Hynix debütiert heute an der Nasdaq, wie wird das ADR-Aufgeld die Bewertung von KI-Speichern neu gestalten?
TradingKey – Die American Depositary Receipts (ADRs) des südkoreanischen Speicherchip-Giganten SK Hynix geben heute ihr offizielles Debüt an der Nasdaq und erzielen bei einem Ausgabepreis von 149 US-Dollar pro Aktie einen Erlös von 26,5 Milliarden US-Dollar. Dies stellt einen neuen Rekord für den größten US-Börsengang eines ausländischen Unternehmens dar und übertrifft die 25 Milliarden US-Dollar schwere Kapitalaufnahme von Alibaba aus dem Jahr 2014. Die Notierung, die als „Lackmustest für den KI-Investitionsenthusiasmus der Wall Street“ beschrieben wird, ist nicht nur ein bedeutendes Kapitalmarktereignis, sondern auch eine konzentrierte Bewertung des Wertpotenzials im Bereich der KI-Speicherchips.
TradingKeyan hour ago
US-Vorbörse: SK Hynix ADR mit 149 $ für Nasdaq-Notierung bepreist, Speicherchip-Aktien unter Druck, Delta Air Lines übertrifft Gewinnerwartungen
TradingKey – Am 10. Juli (US-Ostküstenzeit) zeigten die Futures auf die drei wichtigsten US-Aktienindizes im vorbörslichen Handel eine uneinheitliche Entwicklung. Bis Redaktionsschluss fielen die Nasdaq 100 Index-Futures um 0,34 %, die S&P 500 Index-Futures sanken um 0,05 % und die Dow Jones Index-Futures stiegen um 0,12 %.
TradingKeyan hour ago

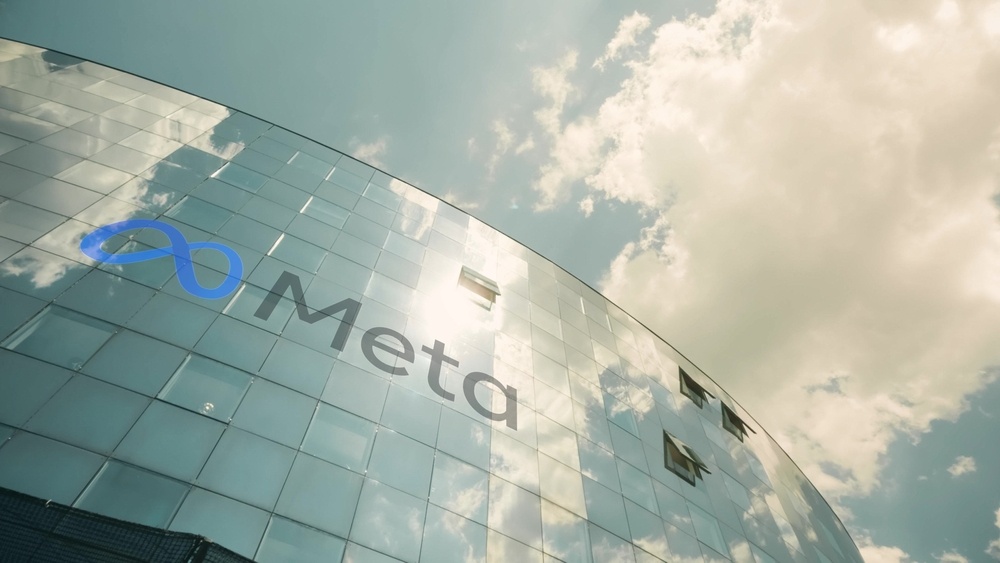
Erstes Bezahlmodell startet, hauseigene Chips ab September in Massenproduktion: Meta lindert Capex-Sorgen der Wall Street durch zweigleisigen Ansatz
TradingKey – Meta (META) war zuletzt verstärkt im KI-Bereich aktiv. Von der Veröffentlichung ihres ersten kostenpflichtigen Programmiermodells bis hin zum Beginn der Massenproduktion ihrer selbst entwickelten KI-Chips hat diese Reihe von Maßnahmen die Anlegerstimmung gegenüber der KI-Strategie des Unternehmens ins Positive gedreht.
TradingKey6 hours ago
Japanische und südkoreanische Aktien legen leicht zu: SoftBank springt um 10 % an die Spitze, Samsung und SK Hynix steigen
Die japanischen und südkoreanischen Aktienmärkte setzten ihre moderate Aufwärtsbewegung fort, wobei der Nikkei 225 den KOSPI übertraf. SoftBank legte um mehr als 10 % zu, während SK Hynix und Samsung Electronics den Gewinnen folgten. Kioxia machte seine anfänglichen Kursgewinne rückgängig und notierte niedriger.
TradingKey6 hours ago

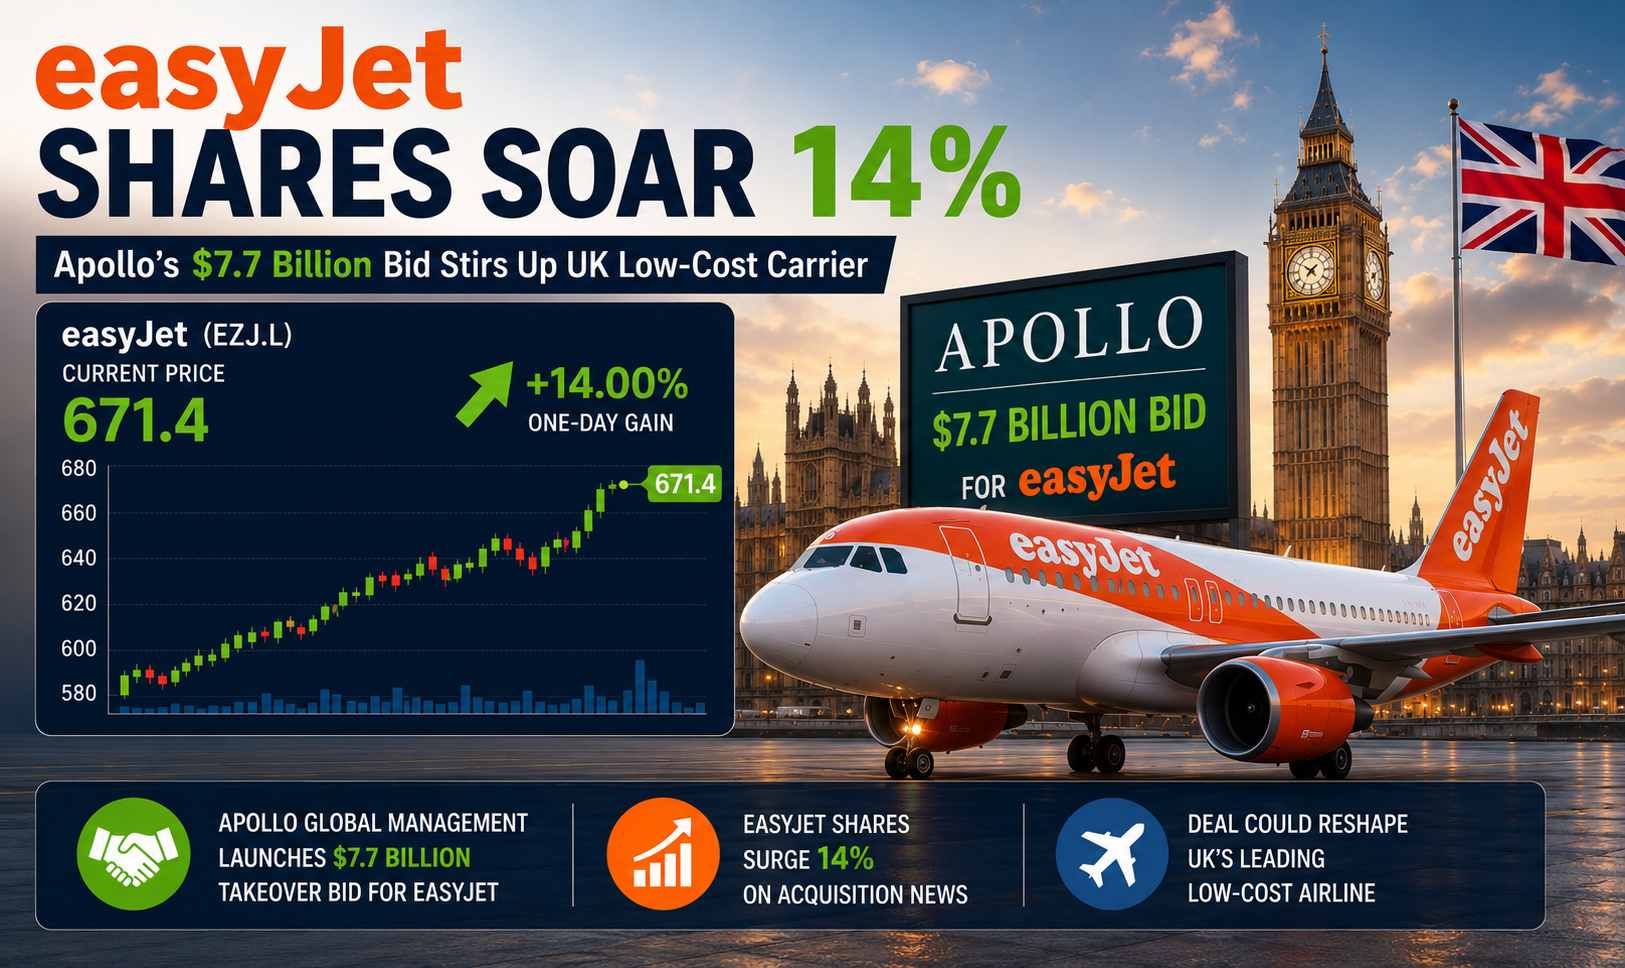
EasyJet-Aktien steigen um 14 %, Apollos 7,7-Milliarden-Dollar-Gebot wirbelt britischen Billigflieger auf
TradingKey - Der Übernahmekampf um easyJet hat innerhalb nur einer Woche eine dramatische Wendung genommen. Der US-Private-Equity-Riese Apollo Global Management (APO) ist mit einem Gebot von 5,7 Milliarden GBP hervorgetreten und übertrifft damit Castlelake, das zuvor eine Grundsatzeinigung erzielt hatte. Dieser Schritt hat den Bieterwettstreit um Europas zweitgrößte Billigfluggesellschaft verschärft.
TradingKey4 hours ago
TradingKey SmartPicks

TK-Verbesserte Colin McLean Wachstums- und Wertquantstrategie
Die Kombination von Fundamentaldaten mit Marktverhalten durch intelligente Algorithmen nutzt dynamische, mehrfrequente Signale, um die Rendite von Wertanlagen in modernen Märkten zu erhöhen.
Änderung der Bestände


Howard Rothman's Prudent Wealth Strategy
Eine intelligente, quantitative Methode, die sich dynamisch an Bullen- und Bärenmärkte anpasst - eine perfekte Kombination aus stetigem Wachstum und präziser Risikosteuerung.
Änderung der Bestände


David Polen: Rationale Wachstumsstrategie
Diese Strategie setzt Davids Polens Anlagephilosophie fort, Unternehmen mit qualitativ hochwertigem Bargeldzufluss zu halten, und führt gleichzeitig das Bewertungsmodell der impliziten Rendite ein. Ziel ist es, durch quantitative Methoden ein ausgewogenes Wachstum im Verhältnis zum Kaufpreis zu erzielen, während die blinde Jagd nach hohen Kursen vermieden wird und jede Position eine angemessene erwartete Rendite aufweist.
Änderung der Bestände


Michael J. Carr: Strategie für geringes Gewinnwachstum
Diese Strategie basiert auf dem von Michael J. Carr vorgeschlagenen Konzept des „profitablen Investierens“. Ihr Grundprinzip besteht nicht darin, Marktbewegungen vorherzusagen, sondern darin, den aktuellen Risikozustand des Marktes zu bestimmen und darauf aufbauend zu entscheiden, ob und wie Risiken eingegangen werden.
Änderung der Bestände


Bevorstehende Ereignisse
Berichte
Dividende
Aktien-Split
Börsengang
2026-07-10
Vorbörsliches Trading
Delta Air Lines Inc
DAL
EPS-Prognose1.46
EPS Tatsächlich--
Einnahmenprognose17.52B
Tatsächliche Einnahmen--
2026-07-13
Nachbörsliches Trading
Grupo Aeromexico SAB de CV
AERO
EPS-Prognose-0.44
EPS Tatsächlich--
Einnahmenprognose1.50B
Tatsächliche Einnahmen--
2026-07-13
Nachbörsliches Trading
Grupo Aeroportuario del Pacifico SAB de CV
PAC
EPS-Prognose3.49
EPS Tatsächlich--
Einnahmenprognose592.14M
Tatsächliche Einnahmen--
2026-07-13
Nachbörsliches Trading
FB Financial Corp
FBK
EPS-Prognose1.15
EPS Tatsächlich--
Einnahmenprognose177.99M
Tatsächliche Einnahmen--
Markt-Heatmap
Aktien
Sektor