

Keine Daten
Suchen
Aktien Marktkurse
Aktienkurse konzentrieren sich auf die Marktdaten der USA, einschließlich Indizes, Sektoren und verwandten US-Aktieninstrumenten.
52555.900+0.24%
7536.400-0.02%
29601.100-0.36%
Verteilung
Neueste
Geschichte
Sektor
Mehr Anzeigen
Industrie- und Gewerbeservices
+4.12%Agroz Ord Shs+16.38%
Lucas GC Ltd+12.60%
Euro Tech Holdings Company Ltd+12.58%
Technologie-Hardware
+3.24%Wrap Technologies Inc+48.11%
nLIGHT Inc+27.37%
MagnaChip Semiconductor Corp+14.95%
Rohstoffressourcen
+2.11%The Metals Royalty Company Ord Shs+9.98%
Scully Royalty Ltd+9.52%
REA.NB+8.95%
Automobile & Autoteile
+2.09%Digital Currency X Technology Ord Shs Class A+12.49%
Rivian Automotive Inc+8.94%
U Power Ltd+6.19%
Erneuerbare Energien
+1.78%XCF Global Ord Shs Class A+11.70%
Zeo Energy Corp+6.88%
Solaredge Technologies Inc+4.52%
Software und IT-Dienstleistungen
+1.74%Trident Digital Tech Holdings Ltd+40.98%
Republic Power Group Ord Shs Class A+32.02%
Supercom Ltd+16.37%
Aktienliste
Nr.
Name
Kurs
Veränderung
Änderung%
Gesamtpunktzahl
Zeit
Volumen
Umsatz
Marktkapitalisierung
Aktien
Preisspanne
Volumen %
52-Wochen-Hoch
52-Wochen-Tief
Dividende
Dividendenrendite
5T
10T
20T
60T
120T
250T
Seit Jahresbeginn
Beobachtungsliste
Aktienanalyse
EasyJet-Aktien steigen um 14 %, Apollos 7,7-Milliarden-Dollar-Gebot wirbelt britischen Billigflieger auf
TradingKey - Der Übernahmekampf um easyJet hat innerhalb nur einer Woche eine dramatische Wendung genommen. Der US-Private-Equity-Riese Apollo Global Management (APO) ist mit einem Gebot von 5,7 Milliarden GBP hervorgetreten und übertrifft damit Castlelake, das zuvor eine Grundsatzeinigung erzielt hatte. Dieser Schritt hat den Bieterwettstreit um Europas zweitgrößte Billigfluggesellschaft verschärft.
TradingKey3 hours ago

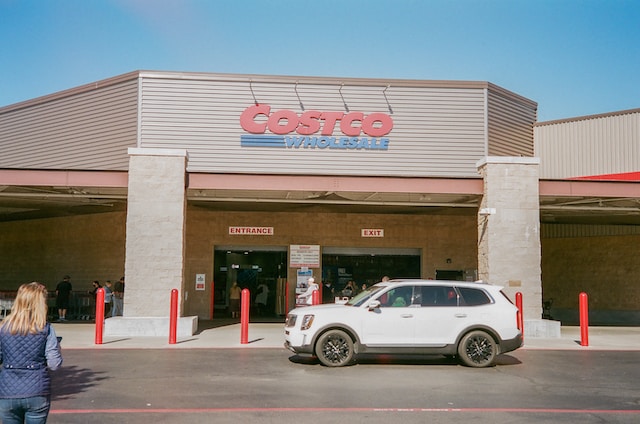
Costco-Aktienkursprognose: Hohe Bewertung trifft auf verlangsamtes Umsatzwachstum, Rückkehr auf 1.000 $ im Juli?
TradingKey - Mit Stand vom 10. Juli (Eastern Time) notierte Costco (COST) zuletzt bei 912,97 $, nachdem der Kurs am 9. Juli um 4,21 % gefallen war und im vorbörslichen Handel leicht um 0,22 % stieg. Der Aktienkurs sank, da neu veröffentlichte Umsatzdaten für Juni auf eine Verlangsamung des Wachstums hindeuteten.
TradingKey3 hours ago
US-Listing von SK Hynix löst Leveraged-ETF-Boom bei Start von sechs neuen Produkten nächste Woche aus
TradingKey – Mit der offiziellen Notierung von SK Hynix an der Nasdaq am 10. Juli löst das US-Börsendebüt des südkoreanischen Halbleiterriesen eine Kettenreaktion aus. Marktquellen zufolge befinden sich sechs neue gehebelte und inverse ETF-Produkte, welche die Wertentwicklung der ADRs von SK Hynix nachbilden, in der letzten Vorbereitungsphase und sollen voraussichtlich nächste Woche gemeinsam gelistet werden, wodurch globalen Anlegern vielfältigere Handelsinstrumente zur Verfügung stehen.
TradingKey4 hours ago

Erstes Bezahlmodell startet, hauseigene Chips ab September in Massenproduktion: Meta lindert Capex-Sorgen der Wall Street durch zweigleisigen Ansatz
TradingKey – Meta (META) war zuletzt verstärkt im KI-Bereich aktiv. Von der Veröffentlichung ihres ersten kostenpflichtigen Programmiermodells bis hin zum Beginn der Massenproduktion ihrer selbst entwickelten KI-Chips hat diese Reihe von Maßnahmen die Anlegerstimmung gegenüber der KI-Strategie des Unternehmens ins Positive gedreht.
TradingKey5 hours ago

Japanische und südkoreanische Aktien legen leicht zu: SoftBank springt um 10 % an die Spitze, Samsung und SK Hynix steigen
Die japanischen und südkoreanischen Aktienmärkte setzten ihre moderate Aufwärtsbewegung fort, wobei der Nikkei 225 den KOSPI übertraf. SoftBank legte um mehr als 10 % zu, während SK Hynix und Samsung Electronics den Gewinnen folgten. Kioxia machte seine anfänglichen Kursgewinne rückgängig und notierte niedriger.
TradingKey5 hours ago

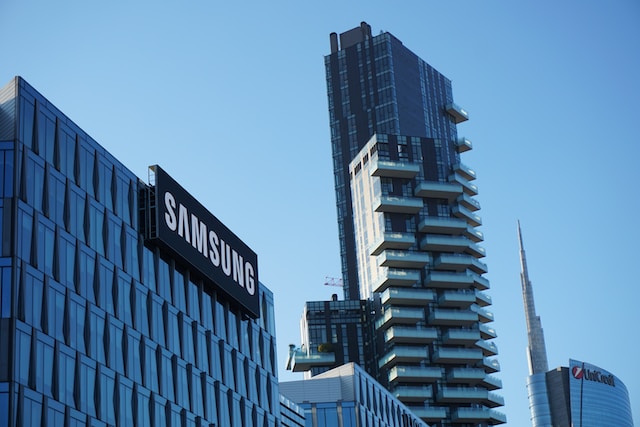
Samsung liefert KI-PC-Chips an Lenovo und HP, um AMD und Apple herauszufordern
TradingKey – Marktberichten zufolge entwickelt Samsung Electronics unter dem Namen GAIA einen dedizierten Chip für KI-PCs und hat der Lenovo Group sowie HP (HPQ) bereits Muster zu Testzwecken zur Verfügung gestellt. Falls die anschließende Verifizierung erfolgreich verläuft und die Massenproduktion beginnt, würde dies Samsungs weitere Expansion in den Markt für Windows-KI-PC-Hauptprozessoren markieren und das Portfolio über mobile Exynos-Prozessoren und Speicherchips hinaus erweitern.
TradingKey5 hours ago
TradingKey SmartPicks

TK-Verbesserte Colin McLean Wachstums- und Wertquantstrategie
Die Kombination von Fundamentaldaten mit Marktverhalten durch intelligente Algorithmen nutzt dynamische, mehrfrequente Signale, um die Rendite von Wertanlagen in modernen Märkten zu erhöhen.
Änderung der Bestände


Howard Rothman's Prudent Wealth Strategy
Eine intelligente, quantitative Methode, die sich dynamisch an Bullen- und Bärenmärkte anpasst - eine perfekte Kombination aus stetigem Wachstum und präziser Risikosteuerung.
Änderung der Bestände


David Polen: Rationale Wachstumsstrategie
Diese Strategie setzt Davids Polens Anlagephilosophie fort, Unternehmen mit qualitativ hochwertigem Bargeldzufluss zu halten, und führt gleichzeitig das Bewertungsmodell der impliziten Rendite ein. Ziel ist es, durch quantitative Methoden ein ausgewogenes Wachstum im Verhältnis zum Kaufpreis zu erzielen, während die blinde Jagd nach hohen Kursen vermieden wird und jede Position eine angemessene erwartete Rendite aufweist.
Änderung der Bestände


Michael J. Carr: Strategie für geringes Gewinnwachstum
Diese Strategie basiert auf dem von Michael J. Carr vorgeschlagenen Konzept des „profitablen Investierens“. Ihr Grundprinzip besteht nicht darin, Marktbewegungen vorherzusagen, sondern darin, den aktuellen Risikozustand des Marktes zu bestimmen und darauf aufbauend zu entscheiden, ob und wie Risiken eingegangen werden.
Änderung der Bestände


Bevorstehende Ereignisse
Berichte
Dividende
Aktien-Split
Börsengang
2026-07-10
Vorbörsliches Trading
Delta Air Lines Inc
DAL
EPS-Prognose1.46
EPS Tatsächlich--
Einnahmenprognose17.52B
Tatsächliche Einnahmen--
2026-07-13
Nachbörsliches Trading
Grupo Aeromexico SAB de CV
AERO
EPS-Prognose-0.44
EPS Tatsächlich--
Einnahmenprognose1.50B
Tatsächliche Einnahmen--
2026-07-13
Nachbörsliches Trading
Grupo Aeroportuario del Pacifico SAB de CV
PAC
EPS-Prognose3.49
EPS Tatsächlich--
Einnahmenprognose592.14M
Tatsächliche Einnahmen--
2026-07-13
Nachbörsliches Trading
FB Financial Corp
FBK
EPS-Prognose1.15
EPS Tatsächlich--
Einnahmenprognose177.99M
Tatsächliche Einnahmen--
Markt-Heatmap
Aktien
Sektor