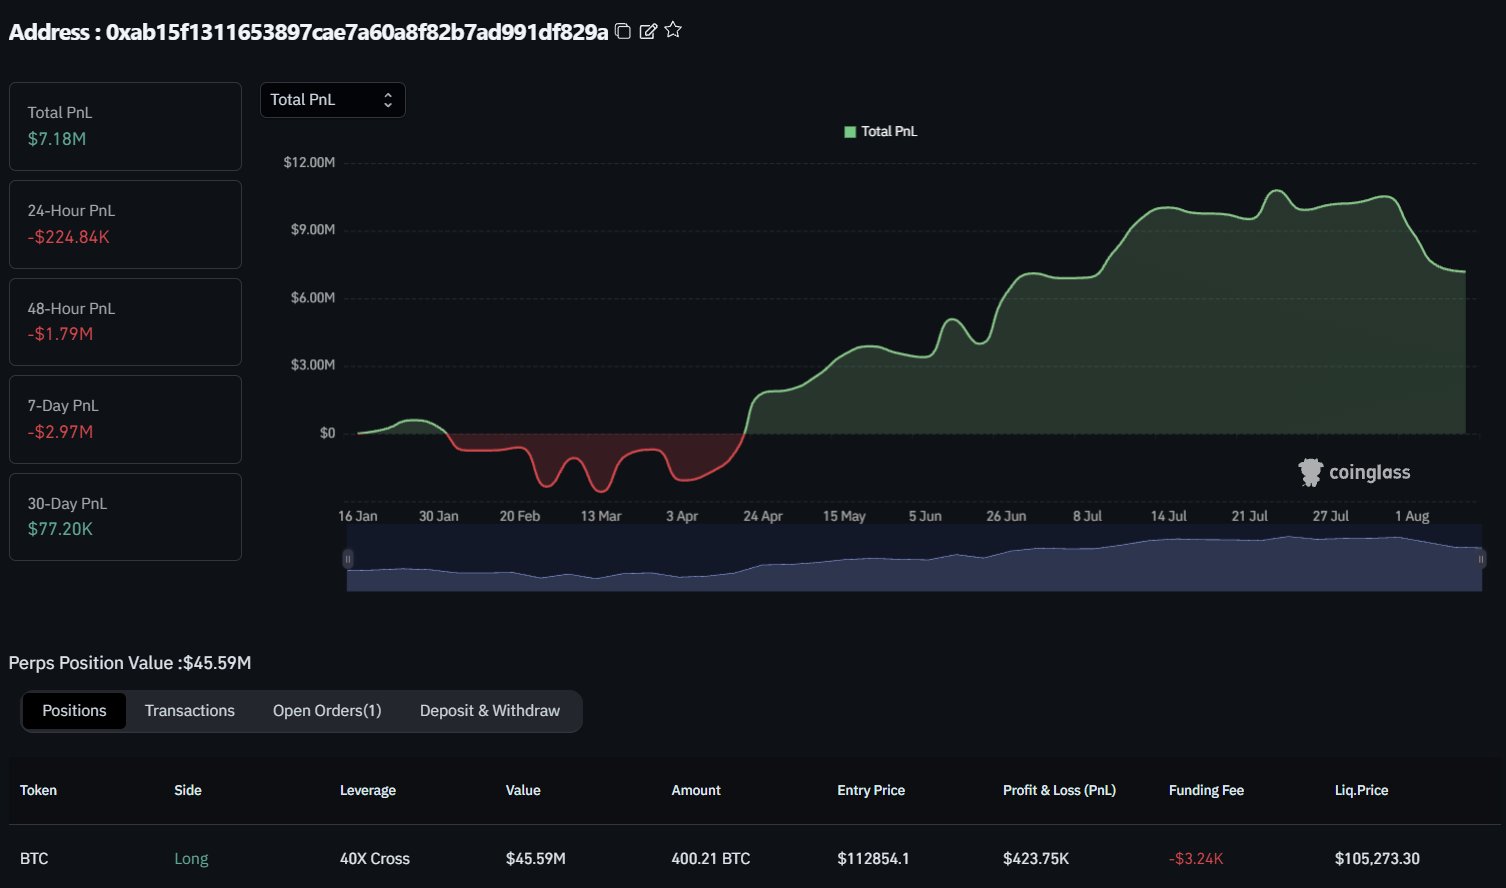
A Bitcoin whale opened a $45M 40x long that liquidates at $105K

A whale just placed a massive Bitcoin bet, $45 million worth, with 40x leverage, according to data from Coinglass. The trade was opened with a liquidation line at $105,000, and if Bitcoin hits $125,000, it’ll trigger $5.6 billion in short liquidations, most of which are clustered near $121,000.
At press time, Bitcoin is trading just above $114,000, which puts the whale’s stop-loss level only a few thousand dollars away. But while some short-term traders are sweating it out, long-term holders aren’t budging.
The Net Unrealized Profit/Loss (NUPL) for Long-Term Holders (LTH) remains above 0.5, meaning they’re still sitting comfortably in profit. These holders are showing no signs of panic, unlike Short-Term Holders (STH), who are now stuck deciding whether to sell at a loss or hold on in underwater positions.
STH wallets are lingering close to breakeven and are contributing to sell pressure during every minor price rally, per data from CryptoQuant.
Selloff on Binance reveals where longs got wiped
On August 1, Binance’s cumulative net taker volume dropped sharply, falling past -$1 billion and crashing to -$1.5 billion, levels not seen since July 25. That metric tracks the difference between aggressive buys and sells, and a deep negative print means the sellers were in full control.
The decline came right after a liquidation that wiped out long positions around $114,000, with a heatmap on Coinglass showing a cluster of liquidations hitting that level, likely from traders who bought into the previous rebound and got caught when the trend reversed.
Also, around the same time, funding rates across Binance, Bitmex, and Deribit all dipped into negative territory, meaning more people started opening shorts, expecting Bitcoin to fall further.

These zones are often referred to as “cold zones” in trading circles, times when traders become heavily tilted toward one side of the book, in this case, shorts. The combination of falling funding and increased short exposure laid the groundwork for massive open interest buildup on the downside.
Retail traders appear to be repeating the same behavior seen in all previous cycles, which is buying near tops and selling near bottoms.” That’s exactly what happened last week, when panic-selling followed long liquidations, then flipped instantly into short builds. It’s the same reflexive loop again; Get long late, get liquidated, get short late, and possibly get squeezed.
Demand-side data shows continued strength
Despite the noise, demand indicators haven’t turned bearish. A chart measuring apparent demand, the difference between newly issued Bitcoin and coins untouched for over a year, shows that the market has absorbed about 160,000 BTC in the past 30 days. That figure means more buying is happening than new supply hitting the market.
Wallets labeled as accumulator addresses, those that only buy and never sell, added close to 50,000 BTC during the same timeframe. These addresses are seen as signals of high conviction buying. There’s no selling history behind them, and they’ve consistently been stacking during the latest price chop.
Off-chain activity shows OTC desks sitting on less Bitcoin than they’ve held in years, per CryptoQuant. Four years ago this time, these desks held roughly 550,000 BTC, but are now at about 145,000 BTC, a 74% tumble. That means big players aren’t offloading. Instead, it looks like the inventory is getting bought and not replaced.
There’s no current sign of demand collapse. Metrics from accumulators, OTC desks, and dormant supply all suggest that long-term positioning is intact. Volatility has affected short-term activity, but longer-term metrics remain stable.
The short-side imbalance is growing, and with that $5.6 billion sitting exposed above $121K, the market is already watching to see if this whale’s position becomes the final nudge that sets it all off.
Get seen where it counts. Advertise in Cryptopolitan Research and reach crypto’s sharpest investors and builders.