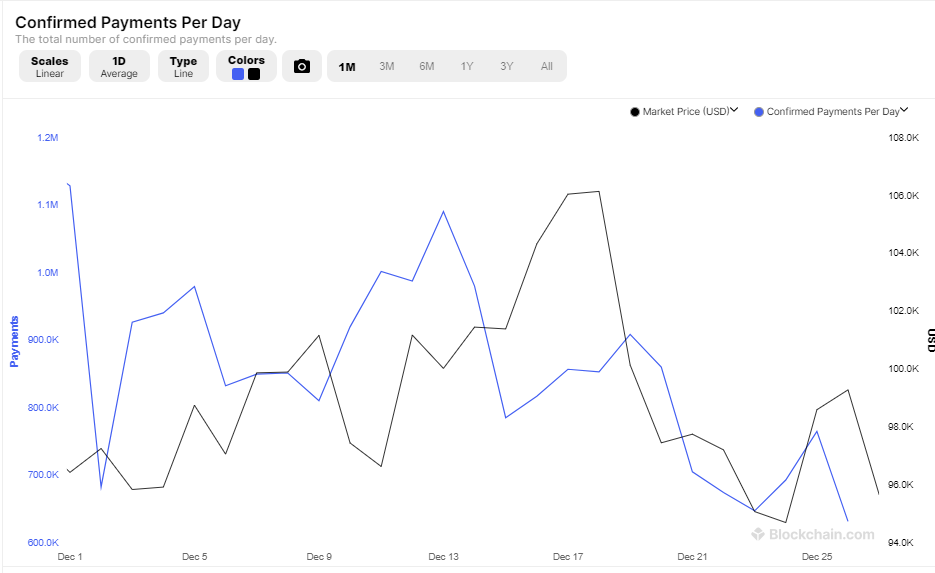
每日确认的Bitcoin支付额触及年度低点——流动性不足打击了比特币鲸鱼

12 月 26 日的数据与 12 月 17 日形成鲜明对比,当时Bitcoin价格达到 108,000 美元的历史最高价,导致超过 857,000 笔确认付款,比近期低点增加了 37%。 从 Blockchain.com 的图表来看,本月Bitcoin支付的高点和低点通常遵循加密货币价格的趋势。当比特币在 12 月 17 日至 18 日左右触及历史高点 108,000 美元时,支付量达到顶峰,但当价格回落至 94,000 美元的低点时,支付量下降。 在过去 30 天内,BTC 接收者数量最高出现在 11 月底,接近 120 万。当时,市值最大的加密货币以 96,000 美元左右的价格易手,市场似乎有很多 FOMO,因为投资者预计该代币很快就会达到 100,000 美元。 鉴于支付数量较低,加密货币爱好者可能会囤积比特币,希望比特币的涨幅甚至高于 11 月至 12 月的价格涨幅。 与此同时,Bitcoin的社会情绪出现下滑,正面评论与负面评论的比例降至4:5,为今年以来的最低情绪水平。尽管 BTC 价格维持在 95,000 美元以上,但散户交易员却表达了高度悲观情绪。 逆向分析师认为,这种恐惧时期可能会先于价格上涨,因为市场走势往往与散户情绪相反。 Bitcoin在 12 月 17 日达到 108,000 美元的峰值,此后已下跌超过 10%,目前交易价格约为 97,150 美元。一些分析师认为,加密货币可能会反弹至 10 万美元以上,理由是历史模式暗示了潜在的反弹。 著名的加密货币分析师 Elja Boom 强调了图表上表明上涨势头的分形模式。然而,Rekt Capital 的相反观点表明,当前的调整可能会持续一周,与 2017 年和 2021 年的类似情况相似。 12 月 26 日,市场技术员 Aksel Kibar 分享了对 X 的分析,概述了Bitcoin的潜在价格目标,并警告可能出现头肩 (H&S) 模式,这是上升趋势逆转的classic指标。 Kibar 表示,Bitcoin未能夺回 100,000 美元的支撑位,开启了从 90,000 美元到 60,000 美元中间的下行目标。 如果该形态为 H&S 顶部,则价格目标为 80K。这可能是对突破 73.7K 后完成的加宽形态的回调。 $BTCUSD https://t.co/aWeNdWVkMz pic.twitter.com/QbGi08AfcHBitcoin图表模式和分析师见解
2025 年的乐观前景
Kibar’s analysis focused on the likelihood of a short-term H&S top forming within Bitcoin’s broader market structure. He explained that if the pattern fully develops, the price could drop to $80,000. This potential decline aligns with a pullback to Bitcoin’s broadening chart pattern breakout, which occurred above $73,700.
In his X post, Kibar noted, “Breakout from the broadening chart pattern that completed on $BTCUSD… the pullback can take place with a possible short-term H&S top. (IF) the right shoulder becomes better defined…”
Further analysis by Kibar outlined how low BTC could fall under this scenario. However, he emphasized that market responses suggest a less severe correction than the H&S pattern might imply. This, in turn, bolsters his position on the possibility of a moderate pullback rather than a steep decline.
Land a High-Paying Web3 Job in 90 Days: The Ultimate Roadmap
相关文章
高市早苗赢得日本国会大选为什么带来了日本股指暴涨,日元为什么延续贬值态势?
TradingKey - 据报道,日本首相高市早苗领导的执政联盟在周日(2月8日)举行的国会选举中已经稳赢单一政党多数席位。受消息影响,日元小幅走软,日经指数史上首次站上57000点。日本东证指数涨幅扩大至3%。
高市早苗的大选豪赌带来哪些影响?日元汇率绝地反击还是一蹶不振?
TradingKey - 2026年的开年大戏,比华尔街的预期来得更猛烈。距离2月8日的日本众议院大选仅剩最后几天,现任首相高市早苗(Sanae Takaichi)正在进行她政治生涯中最大的一次豪赌。
美元走势预测:美元指数跌破97.0至4年新低,2026年美元继续下跌还是触底反弹?
TradingKey - 2026年1月份,美元指数延续2025年的下跌走势,正式跌破97.0关键关口,最低下探至95.5,创下自2022年2月以来的近4年新低。