

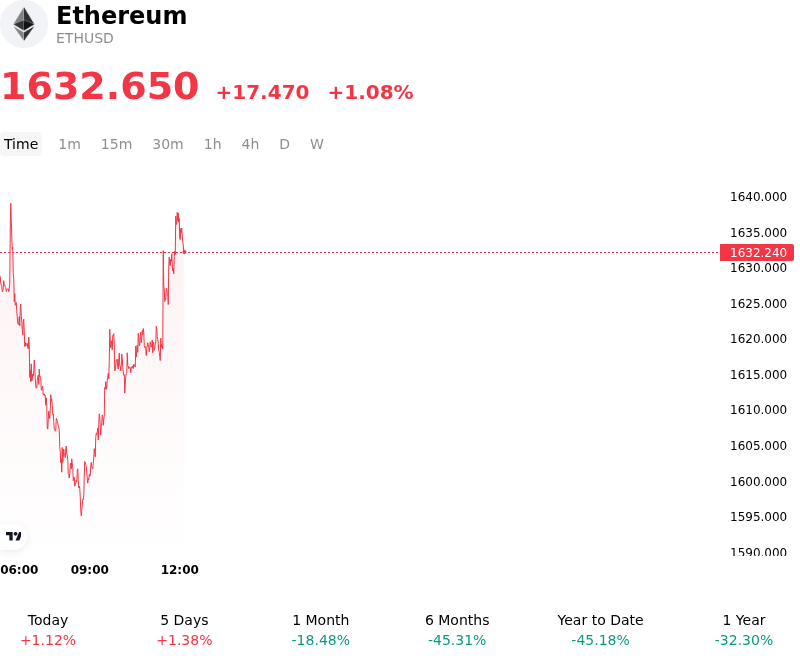
Ethereum (ETHUSD) Suddenly Goes up 1.08% on Jul 2: What You Need to Watch

Ethereum (ETHUSD) is up 1.08% at Jul 2 00:10(ET), now at $1632.65, with a 7-day up of 4.80%.
What is driving Ethereum (ETHUSD)’s stock price up today?
The upward price movement in Ethereum is primarily attributed to a constructive shift in global macroeconomic sentiment following reassuring statements from Federal Reserve officials. Comments acknowledging lower inflation risks helped soothe persistent investor anxieties regarding further monetary tightening, leading market participants to recalibrate their expectations for near-term interest rate hikes. This softening of the macroeconomic outlook fostered a risk-on environment, prompting capital inflows into major digital assets and providing a solid foundation for Ethereum to reclaim key support levels.
Underpinning this macro-driven relief rally was a stabilization in institutional demand channels. Despite recent headwinds and cautious bank forecasts, US-listed spot Ethereum exchange-traded funds recorded positive net daily inflows, driven by strong buying interest in major offerings like BlackRock's ETF. This positive flow was complemented by the strategic launch of Ethereum Institutional, an independent non-profit backed by major ecosystem participants including ConsenSys founder Joe Lubin, BitMine, and SharpLink. Designed to bridge the gap between traditional finance and decentralized architecture, the initiative bolstered long-term institutional adoption expectations by providing a structured framework for banks and corporate treasuries to engage with the network.
On-chain developments and structural upgrades also supported investor confidence. The broader decentralized finance ecosystem received a boost in activity following Robinhood's integration of a high-yield savings product on the Morpho lending protocol, highlighting growing utility. Simultaneously, long-term investors focused on protocol-level progress as testnet deployments for the highly anticipated Glamsterdam upgrade drew closer. The upgrade, focusing on parallel transaction processing and enshrined proposer-builder separation, continues to strengthen Ethereum’s structural roadmap.
From a technical and market structure perspective, Ethereum's advance was accelerated by a clean breakout above a key descending trendline resistance around the sixteen hundred dollar mark. The breakout triggered a significant short squeeze, leading to tens of millions of dollars in short liquidations across major derivatives exchanges. This cascade of forced buying amplified the intraday volatility, reinforcing the near-term bullish momentum and driving the asset to consolidate its gains.
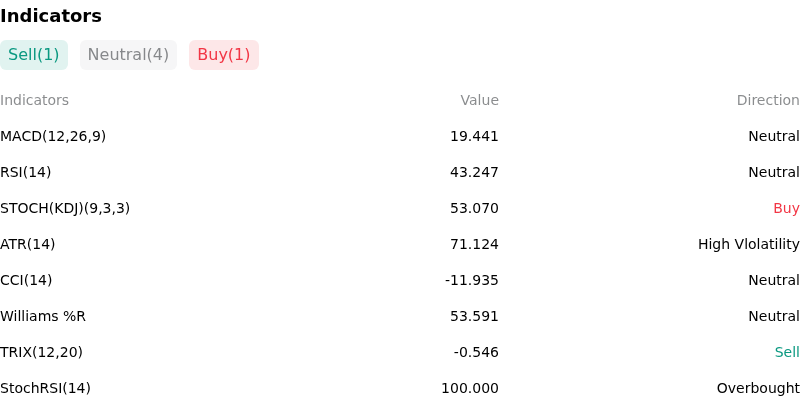
Technical Analysis of Ethereum (ETHUSD)
Technically, Ethereum (ETHUSD) shows a MACD (12,26,9) value of 19.441, indicating a neutral signal. The RSI at 43.247 suggests neutral condition and the Williams %R at 53.591 suggests neutral condition. Please monitor closely.
More details about Ethereum (ETHUSD)
Recent Events and Risks:
- Substantial Whale Selling and Loss Realization: Over the past week, Ethereum whales distributed approximately 550,000 ETH, injecting roughly $880 million in immediate sell-side pressure. Highlighting this capital exit, digital asset firm FG Nexus completed a full liquidation of its ETH holdings on July 1, depositing its final 9,481 ETH into Galaxy Digital and realizing an aggregate loss of $86.6 million.
- Persistent Spot ETF Outflows and Reduced Demand: Institutional demand remains severely depressed, with U.S. spot Ethereum ETFs experiencing a punishing multi-session streak of net outflows, including $12.85 million in redemptions on June 26. This lack of buying support is leaving the market highly vulnerable to downside volatility, as corporate treasury purchases have failed to absorb the persistent sell-side volume.
- Deteriorating Network Revenue and Deflationary Headwinds: Ethereum base-layer usage is weakening, with monthly network fees dropping to $10.7 million in June compared to $24.4 million in April. This drop in on-chain activity has significantly reduced the amount of ETH burned, presenting supply-inflation risks and undermining the asset's structural valuation model.
- Bearish Technical and Derivatives Structure: ETH closed Q2 2026 under heavy pressure, suffering its first-ever run of three consecutive red quarterly quarters in its trading history. Trading well below its daily 20, 50, and 100 EMAs, a failure to defend the key horizontal support zone between $1,500 and $1,550 exposes the cryptocurrency to a deeper liquidation cascade down to the $1,275 area.
This article may include AI-generated content that is human-reviewed, which is for reference and general information purposes only and does not constitute investment advice.
Recommended Articles


Comments (0)
Click the $ button, enter the symbol, and select to link a stock, ETF, or other ticker.