USD/TRY
USDTRY43.526USD
Today
+0.16%
5 Days
+0.25%
1 Month
+1.35%
6 Months
+7.62%
Year to Date
+1.61%
1 Year
+21.23%
Key Data Points
Opening Price
43.454Previous Closing Price
43.455Indicators
The Indicators feature provides value and direction analysis for various instruments under a selection of technical indicators, together with a technical summary.
This feature includes nine of the commonly used technical indicators: MACD, RSI, KDJ, StochRSI, ATR, CCI, WR, TRIX and MA. You may also adjust the timeframe depending on your needs.
Please note that technical analysis is only part of investment reference, and there is no absolute standard for using numerical values to assess direction. The results are for reference only, and we are not responsible for the accuracy of the indicator calculations and summaries.
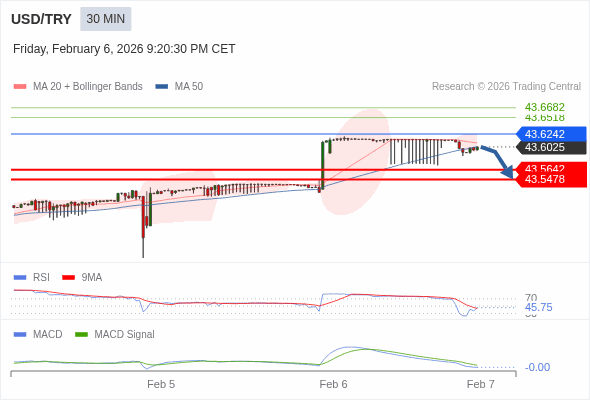
USD/TRY Trading Strategy

Trading Strategy
The configuration is negative.
Alternative scenario
above 43.6242, look for 43.6518 and 43.6682.
Comment
the downside prevails as long as 43.6242 is resistance
USD/TRY News
Turkey Consumer Price Index (MoM) came in at 4.84%, above forecasts (4.32%) in January
Turkey Consumer Price Index (MoM) came in at 4.84%, above forecasts (4.32%) in January

Turkey Consumer Price Index (YoY) came in at 30.65%, above forecasts (30%) in January
Turkey Consumer Price Index (YoY) came in at 30.65%, above forecasts (30%) in January

Turkey Trade Balance dipped from previous -8B to -9.3B in December
Turkey Trade Balance dipped from previous -8B to -9.3B in December

Turkey Economic Confidence Index down to 99.4 in December from previous 99.5
Turkey Economic Confidence Index down to 99.4 in December from previous 99.5

TRY: Short-lived rally signals ongoing challenges – Commerzbank
The Turkish Lira's recent rally was short-lived, with USD/TRY trading higher than before the central bank's rate decision. Analysts maintain a bearish outlook, citing ongoing inflation challenges and ineffective monetary policy.

TRY: CBT seen cutting rates by 150bp as easing cycle continues – ING
Turkey’s central bank (CBT) is expected to deliver a 150bp rate cut at today’s MPC meeting, with markets focused on whether policymakers signal scope to maintain that pace in coming months, ING's FX analyst Frantisek Taborsky notes.

More Details of USD/TRY
What is the significance of Turkey's position as an emerging market?
How does inflation impact USDTRY?
What role do geopolitical events play in USDTRY fluctuations?
Related Instruments
Popular Symbols


