Indicators
Indicators
Value
Direction
MACD(12,26,9)
-0.085
Neutral
RSI(14)
54.691
Neutral
STOCH(KDJ)(9,3,3)
17.549
Oversold
ATR(14)
0.168
Low Volatility
CCI(14)
-138.180
Sell
Williams %R
79.410
Sell
TRIX(12,20)
0.102
Sell
StochRSI(14)
20.406
Buy


21.603
Today
+0.12%
5 Days
-1.02%
1 Month
+1.99%
6 Months
+4.42%
Year to Date
+5.09%
1 Year
+3.18%
Opening Price
21.581Previous Closing Price
21.574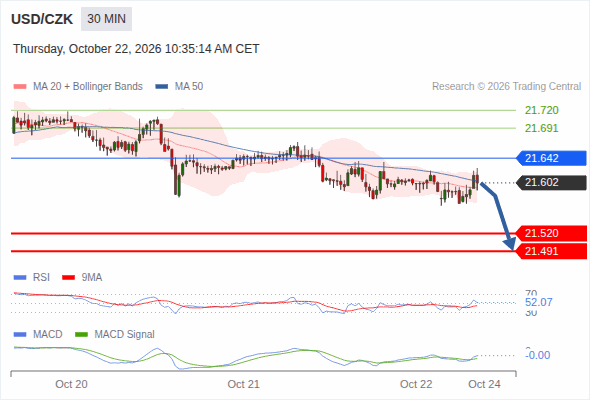
The downside prevails as long as 21.642 is resistance, with 21.520 and 21.491 as targets
above 21.642, look for 21.691 and 21.720.
The downside prevails as long as 21.642 is resistance, with 21.520 and 21.491 as targets
BNY Mellon’s Geoff Yu notes that Central and Eastern European (CEE) assets have underperformed in October, with CE3 FX (Polish Zloty, Czech Koruna and Hungarian Forint) carry versus EUR and USD lagging cash returns and reflecting markets’ belief that CEE central banks cannot match European Central B
Commerzbank’s Tatha Ghose expects the MNB to keep its base rate at 5.50% and argues that Hungary’s recovering real economy and re‑accelerating seasonally adjusted inflation momentum do not justify easing.
ING’s Frantisek Taborsky highlights Hungary’s draft budget as key for regional bonds, with much optimism already priced on a deficit below 5% of GDP. He expects the National Bank of Hungary to keep rates at 5.50%, the Central Bank of Turkey to resume cuts to 36.00%, and EUR/RON to stabilise around 5.340, while another Czech rate hike is seen in November.
ING’s Frantisek Taborsky argues recent Central and Eastern European (CEE) FX and rates gains may not last. Czech inflation data show core rising to 3.1%, reinforcing expectations for a Czech National Bank (CNB) rate hike in November unless geopolitics improve.
ING strategist Frantisek Taborsky expects the NBP to delay rate hikes until early 2027, with government fuel-price measures allowing policymakers to remain patient. He sees the EUR/PLN trading range shifting higher to 4.380–4.400 amid a strong US Dollar, rising energy prices and risk aversion.
ING’s Frantisek Taborsky highlights pressure on the Polish Zloty and Romanian Leu. With the National Bank of Poland holding rates at 3.75%, a dovish policy message could push EUR/PLN towards 4.380–4.400.
The Indicators feature provides value and direction analysis for various instruments under a selection of technical indicators, together with a technical summary.
This feature includes nine of the commonly used technical indicators: MACD, RSI, KDJ, StochRSI, ATR, CCI, WR, TRIX and MA. You may also adjust the timeframe depending on your needs.
Please note that technical analysis is only part of investment reference, and there is no absolute standard for using numerical values to assess direction. The results are for reference only, and we are not responsible for the accuracy of the indicator calculations and summaries.