tradingkey.logotradingkey.logo
Discount
Tradingkey

GBP/NOK

GBPNOK
Add to Watchlist
12.747
-0.007-0.05%
TradingKey Chart
Time
1m
15m
30m
1h
4h
D
W
M
D

Today

-0.04%

5 Days

+0.52%

1 Month

+1.60%

6 Months

+2.65%

Year to Date

-5.99%

1 Year

-3.86%

Key Data Points

Opening Price

12.755

Previous Closing Price

12.754
Price Range of the Day
12.71012.790
52-Week Price Range
12.29513.690

GBP/NOK Trading Strategy

Intraday
Short Term
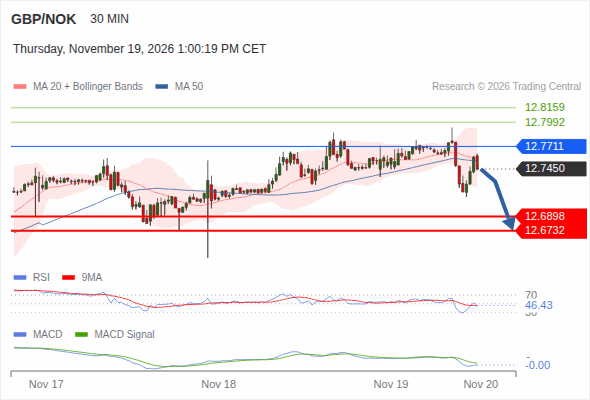
The downside prevails as long as 12.7711 is resistance, with 12.6898 and 12.6732 as targets

Trading Strategy

The downside prevails as long as 12.7711 is resistance, with 12.6898 and 12.6732 as targets

Alternative scenario

above 12.7711, look for 12.7992 and 12.8159.

Comment

The downside prevails as long as 12.7711 is resistance, with 12.6898 and 12.6732 as targets

3 hours ago
Source: Trading Central(Reference Only)
More news coming soon, stay tuned...

Indicators

The Indicators feature provides value and direction analysis for various instruments under a selection of technical indicators, together with a technical summary.

This feature includes nine of the commonly used technical indicators: MACD, RSI, KDJ, StochRSI, ATR, CCI, WR, TRIX and MA. You may also adjust the timeframe depending on your needs.

Please note that technical analysis is only part of investment reference, and there is no absolute standard for using numerical values to assess direction. The results are for reference only, and we are not responsible for the accuracy of the indicator calculations and summaries.


1m
5m
15m
30m
1h
2h
4h
D
W
M
1m
5m
15m
D
Buy
Sell(1)
Neutral(1)
Buy(8)
Indicators
Sell(1)
Neutral(1)
Buy(2)
Indicators
Value
Direction
MACD(12,26,9)
0.055
Buy
RSI(14)
63.301
Neutral
STOCH(KDJ)(9,3,3)
83.039
Overbought
ATR(14)
0.116
Low Volatility
CCI(14)
101.187
Buy
Williams %R
9.652
Overbought
TRIX(12,20)
0.055
Sell
StochRSI(14)
82.496
Overbought
Moving Average
Sell(0)
Neutral(0)
Buy(6)
Indicators
Value
Direction
MA5
12.713
Buy
MA10
12.684
Buy
MA20
12.555
Buy
MA50
12.584
Buy
MA100
12.689
Buy
MA200
12.708
Buy

About GBP/NOK

The GBP/NOK currency pair represents the exchange rate between the British Pound (GBP) and the Norwegian Krone (NOK). This pair is significant for traders and investors interested in the relationship between the UK and Norway, particularly in terms of trade, economic conditions, and commodity prices, as Norway is a major oil exporter. The GBP/NOK pair can exhibit volatility influenced by economic data releases, geopolitical developments, and shifts in market sentiment.

How does Brexit impact GBP/NOK?

Brexit-related developments can create uncertainty for the GBP, impacting its value against the NOK, particularly in relation to trade agreements and economic forecasts.

What are the risks associated with trading GBP/NOK?

Traders should consider risks such as market volatility, geopolitical events, and changes in economic conditions that could impact the exchange rate.

How does oil impact GBP/NOK?

As a major oil exporter, Norway’s economy is heavily influenced by oil prices. Rising oil prices typically strengthen the NOK, while falling prices can lead to depreciation.

Is GBPNOK (GBPNOK) a safe investment?

No investment is completely risk-free. The risk level of GBPNOK (GBPNOK) depends on its underlying assets, strategy, liquidity, fees, and market conditions. Diversification may reduce potential losses but cannot eliminate them, and past performance does not guarantee future results. Before investing, consider whether the fund aligns with your goals and risk tolerance. This is not investment advice.

GBP/NOK

12.747
-0.007-0.05%
tradingkey.logotradingkey.logo
Risk Warning: Our Website and Mobile App provides only general information on certain investment products. Finsights does not provide, and the provision of such information must not be construed as Finsights providing, financial advice or recommendation for any investment product.
Investment products are subject to significant investment risks, including the possible loss of the principal amount invested and may not be suitable for everyone. Past performance of investment products is not indicative of their future performance.
Finsights may allow third party advertisers or affiliates to place or deliver advertisements on our Website or Mobile App or any part thereof and may be compensated by them based on your interaction with the advertisements.
© Copyright: FINSIGHTS MEDIA PTE. LTD. All Rights Reserved.