GBP/CAD
GBPCAD1.860USD
Today
+0.30%
5 Days
-0.10%
1 Month
-0.30%
6 Months
+0.69%
Year to Date
+0.58%
1 Year
+5.01%
Key Data Points
Opening Price
1.854Previous Closing Price
1.854Indicators
The Indicators feature provides value and direction analysis for various instruments under a selection of technical indicators, together with a technical summary.
This feature includes nine of the commonly used technical indicators: MACD, RSI, KDJ, StochRSI, ATR, CCI, WR, TRIX and MA. You may also adjust the timeframe depending on your needs.
Please note that technical analysis is only part of investment reference, and there is no absolute standard for using numerical values to assess direction. The results are for reference only, and we are not responsible for the accuracy of the indicator calculations and summaries.
GBP/CAD Trading Strategy

Trading Strategy
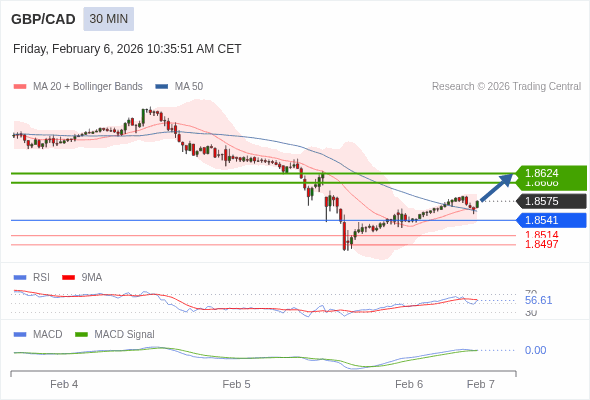
The configuration is positive.
Alternative scenario
below 1.8541, expect 1.8514 and 1.8497.
Comment
the upside prevails as long as 1.8541 is support
GBP/CAD News
GBP/CAD weakens as sticky UK inflation does little to shift BoE outlook
The British Pound (GBP) edges lower against the Canadian Dollar (CAD) on Wednesday, as the latest UK inflation data fails to derail market expectations for a gradual easing path from the Bank of England (BoE). At the time of writing, GBP/CAD trades around 1.8540, down nearly 0.22% on the day.

GBP/CAD steady as markets digest mixed Canada employment report
The Canadian Dollar (CAD) trades little changed against the British Pound (GBP) on Friday, with GBP/CAD struggling to find direction as traders show a muted reaction to Canada’s latest employment report. At the time of writing, the pair trades around 1.8636, hovering near one-month highs.

GBP/CAD firms as BoE delivers a cautious rate cut
The British Pound (GBP) edges higher against the Canadian Dollar (CAD) on Wednesday, reversing earlier losses as markets digest the Bank of England’s (BoE) latest monetary policy decision. At the time of writing, GBP/CAD trades near 1.8478, rebounding from a daily low around 1.8384.

GBP/CAD tumbles to August lows as BoC signals end of easing cycle
The British Pound (GBP) continues to lose ground against the Canadian Dollar (CAD) on Wednesday as traders react to the Bank of Canada’s (BoC) “hawkish cut.” At the time of writing, GBP/CAD trades around 1.8381, hovering near its lowest level since early August and extending losses for the ninth str

GBP/CAD slides to four-week low as UK gilt rout rattles Sterling, Canada PMI shows improvement
The Pound Sterling (GBP) faces broad-based selling pressure on Tuesday, with GBP/CAD tumbling sharply as concerns over the United Kingdom's (UK) fiscal trajectory and surging Gilt yields dominate market sentiment.

GBP/JPY: Pound Sterling cross rates mixed at the start of the European session
Pound Sterling (GBP) crosses trade mixed at the start of Tuesday, according to FXStreet data. The Pound Sterling (GBP) to the Japanese Yen changes hands at 188.02, with the GBP/JPY pair declining from its previous close at 188.44.

More Details of GBP/CAD
Can I trade GBPCAD on a mobile platform?
What is the minimum capital required to trade GBPCAD?
Is GBPCAD sensitive to commodity prices?
Related Instruments
Popular Symbols


