Indicators
Indicators
Value
Direction
MACD(12,26,9)
-0.001
Sell
RSI(14)
34.286
Neutral
STOCH(KDJ)(9,3,3)
39.098
Buy
ATR(14)
0.009
Low Volatility
CCI(14)
-54.926
Neutral
Williams %R
71.149
Sell
TRIX(12,20)
-0.107
Sell
StochRSI(14)
100.000
Overbought


Today
+0.04%
5 Days
+0.09%
1 Month
-2.27%
6 Months
-1.61%
Year to Date
-2.78%
1 Year
-3.01%
Opening Price
1.566Previous Closing Price
1.566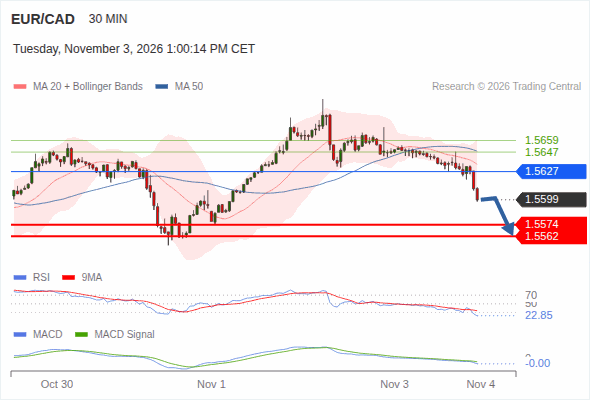
The downside prevails as long as 1.5627 is resistance, with 1.5574 and 1.5562 as targets
above 1.5627, look for 1.5647 and 1.5659.
The downside prevails as long as 1.5627 is resistance, with 1.5574 and 1.5562 as targets
EUR/CAD depreciates after registering gains the previous day, trading around 1.5620 during European hours on Tuesday. The currency cross is facing challenges as the Canadian Dollar (CAD) receives strong support from rising crude oil prices.
EUR/CAD gains over 0.5% after registering modest gains the previous day, trading around 1.5680 during Asian hours on Monday. The currency cross rises as the Euro (EUR) remains stronger following the release of German economic data.
EUR/CAD continues its losing streak that began on October 16, trading around 1.5580 during European hours on Thursday. The currency cross depreciated as the Euro (EUR) lost ground ahead of the European Central Bank’s (ECB) upcoming policy decision.
EUR/CAD trades around 1.5640 on Wednesday, gaining 0.06% on the day at the time of writing, despite the Bank of Canada’s (BoC) decision to raise its benchmark interest rate by 25 basis points (bps) to 2.50%.
EUR/CAD inches higher after six days of losses, trading around 1.5640 during European hours on Wednesday. The currency cross moved little ahead of the Bank of Canada’s (BoC) policy decision scheduled for later in the day, with financial markets largely pricing in a 25-basis-point interest rate hike.
EUR/CAD extends its losses for the sixth successive day, trading around 1.5650 during European hours on Tuesday. The currency cross depreciates as the Euro (EUR) faces challenges ahead of the looming European Central Bank (ECB) policy decision this week.
The Indicators feature provides value and direction analysis for various instruments under a selection of technical indicators, together with a technical summary.
This feature includes nine of the commonly used technical indicators: MACD, RSI, KDJ, StochRSI, ATR, CCI, WR, TRIX and MA. You may also adjust the timeframe depending on your needs.
Please note that technical analysis is only part of investment reference, and there is no absolute standard for using numerical values to assess direction. The results are for reference only, and we are not responsible for the accuracy of the indicator calculations and summaries.