

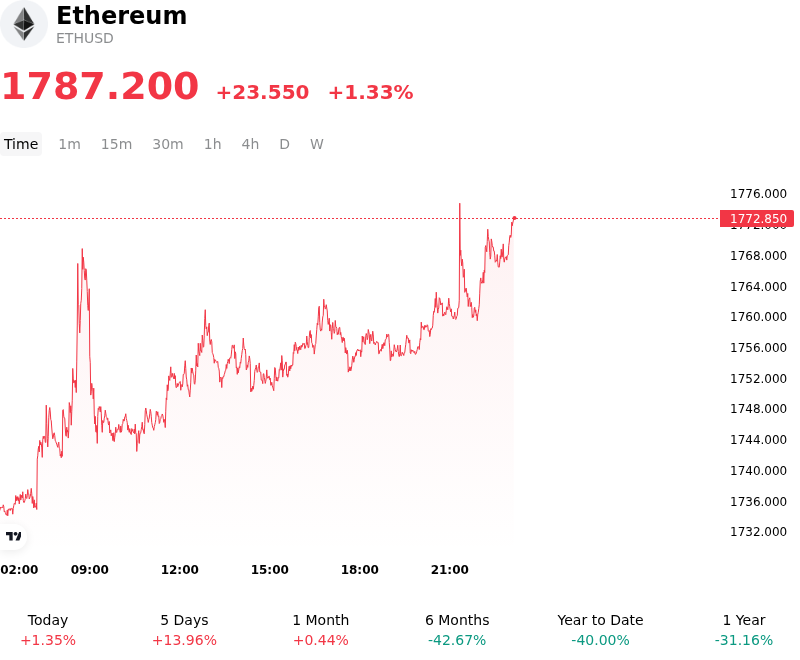
Ethereum (ETHUSD) Is up 1.33% on Jul 4: Here Is Why

Ethereum (ETHUSD) is up 1.33% at Jul 4 11:10(ET), now at $1787.2, with a 7-day up of 13.19%.
What is driving Ethereum (ETHUSD)’s stock price up today?
Ethereum advanced as capital flows stabilized following a prolonged period of downside pressure, driven by a combination of recovering spot ETF demand, improved macroeconomic sentiment, and key on-chain indicators pointing to long-term accumulation.
The primary catalyst for the positive shift in market sentiment was the end of a persistent nine-day streak of net outflows for U.S. spot Ethereum ETFs. The structural demand via regulated fund vehicles logged back-to-back sessions of positive net inflows. This recovery was heavily supported by consistent inflows into major products like BlackRock's ETF, which offset continuing minor outflows from Grayscale's product. This reversal of ETF capital flows signaled a return of steady institutional appetite and alleviated worries of a broader risk-off liquidation.
In addition to improving ETF dynamics, macroeconomic conditions became highly supportive of digital assets. Weakening economic indicators out of the United States—specifically softer labor market data—fueled investor expectations that the Federal Reserve would adopt a less hawkish monetary stance. The soft economic data put downward pressure on both the U.S. dollar and Treasury yields. Since crypto assets are highly sensitive to global liquidity conditions, the weaker dollar and falling yields boosted global risk appetite, providing a favorable backdrop for Ethereum to build momentum.
On-chain metrics further reinforced the bullish structure. High volumes of Ethereum withdrawals from major exchanges like Binance were reported, hitting multi-year highs. Massive withdrawal spikes typically indicate that holders are moving their assets off trading platforms and into cold storage or decentralized finance platforms for yield generation, thereby reducing active exchange reserves and lessening immediate selling pressure. This shift, alongside continued staking activity, lockups, and corporate treasury accumulations, suggests that structural investors are treating the low price levels as a high-value accumulation zone.
Despite this recovery, institutional digital asset investors continue to closely monitor structural risks. The primary concerns remain centered on macroeconomic uncertainty, upcoming monetary policy decisions, and regulatory developments within the United States as legislative frameworks progress through Congress. However, the current confluence of returning ETF inflows, constructive macro liquidity signals, and an on-chain supply squeeze has successfully generated near-term support and propelled the asset upward.
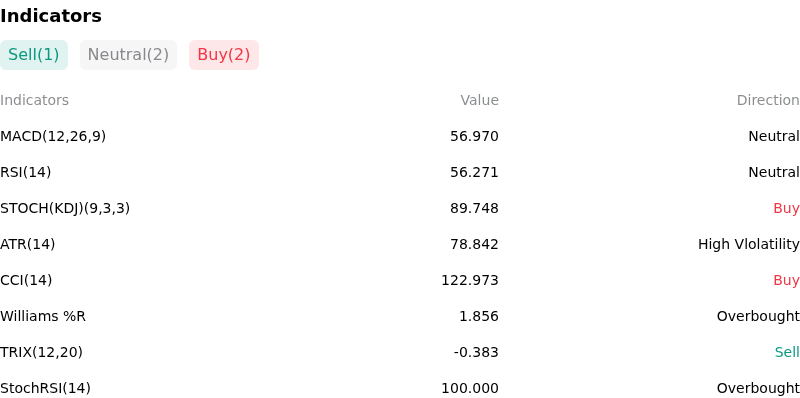
Technical Analysis of Ethereum (ETHUSD)
Technically, Ethereum (ETHUSD) shows a MACD (12,26,9) value of 56.970, indicating a neutral signal. The RSI at 56.271 suggests neutral condition and the Williams %R at 1.856 suggests overbought condition. Please monitor closely.
More details about Ethereum (ETHUSD)
Recent Events and Risks:
- Severe Structural Underperformance and Trend Weakness: Ethereum closed out the second quarter of 2026 marking an unprecedented three consecutive quarterly losses (down roughly 28% in Q4 2025, 29% in Q1 2026, and 25% in Q2 2026). ETHUSD remains pinned below its primary daily exponential moving averages (EMAs)—including the 20-day, 50-day, and 200-day EMAs—leaving the asset structurally vulnerable to deeper technical sell-offs toward the $1,500 and $1,275 support zones if current market-maker levels fail to hold.
- Subdued Institutional Demand and Persistent ETF Outflows: Despite brief intraday relief, US spot Ethereum ETFs experienced massive capital retrenchment, recording over $529 million in net outflows during June 2026. Recent sessions have reinforced this trend, including a $1.61 million outflow from the Fidelity Ethereum Fund (FETH) on July 2, highlighting weak institutional conviction and making near-term price gains highly fragile without a return of durable inflows.
- Fading On-Chain Network Activity: Fundamental demand on the Ethereum mainnet is flashing warning signs, with active network addresses collapsing by roughly 46% from their early 2026 peak of 795,000 down to a 14-day average of approximately 420,000. This decay in underlying utility reduces on-chain fee generation, limits ETH burn rates, and reduces the network's organic economic floor.
- Disproportionate Derivatives Leverage and Liquidation Risk: The gap between cautious spot activity and aggressive derivative positioning presents elevated systemic risk. Retail traders have maintained highly leveraged long biases, pushing the ETH/USDT long-short account ratio on major exchanges like Binance and OKX past 2.3. This skewed leverage led to over $74 million in ETH liquidations in a 24-hour window, indicating that any sudden downward price pressure will likely trigger a rapid liquidation cascade.
This article may include AI-generated content that is human-reviewed, which is for reference and general information purposes only and does not constitute investment advice.
Recommended Articles


Comments (0)
Click the $ button, enter the symbol, and select to link a stock, ETF, or other ticker.