

Ethereum (ETHUSD) Is up 1.08% on Jul 1: Here Is Why

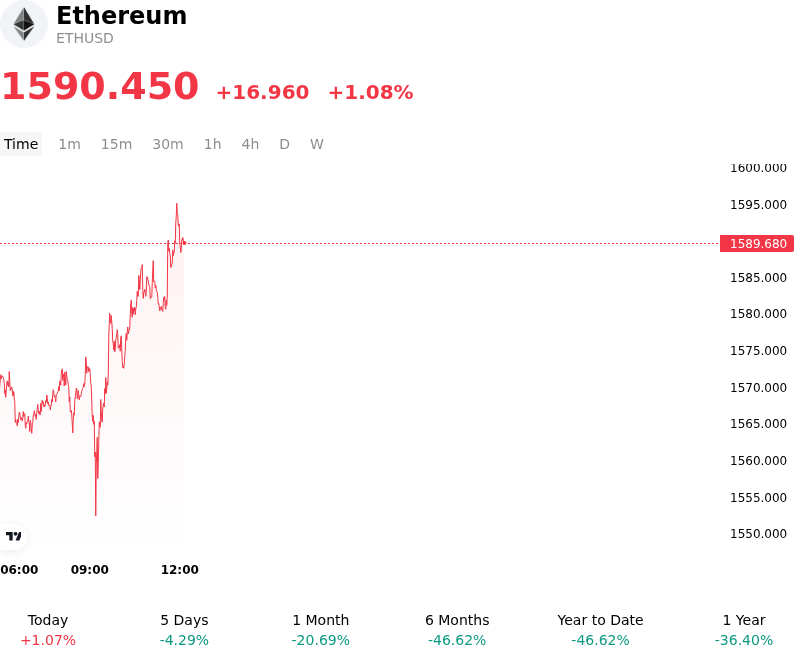
Ethereum (ETHUSD) is up 1.08% at Jul 1 00:10(ET), now at $1590.45, with a 7-day down of 1.28%.
What is driving Ethereum (ETHUSD)’s stock price up today?
The digital asset market observed heightened volatility as the third quarter commenced, with Ethereum experiencing notable intraday price fluctuations amidst a shifting regulatory and institutional landscape. The primary driver behind the immediate market sentiment was the official implementation of the Markets in Crypto-Assets (MiCA) regulation in the European Union. This major regulatory milestone forced unlicensed cryptocurrency platforms to withdraw from the European Economic Area, leading to a substantial reshuffling of capital and localized liquidity disruptions. As investors adjusted to the strict new compliance environment, short-term capital flight and platform migrations introduced friction into the spot market.
Further weighing on investor sentiment was a continued softening in institutional demand, as reflected in the spot exchange-traded fund (ETF) market. US-listed spot Ethereum ETFs recorded net outflows, aligning with broader retrenchment from digital asset investment products as macro liquidity remained constrained. This institutional cool-off was compounded by macroeconomic headwinds, including a stubbornly robust US dollar and elevated Treasury yields, which dampened risk appetite across both equity and crypto markets. Additionally, on-chain dynamics indicated localized selling pressure, highlighted by large-scale liquidations from prominent trading entities clearing out their remaining Ethereum positions.
Despite these bearish pressures, a complete breakdown in valuation was prevented by structural accumulation and long-term positioning. On-chain data revealed that while active address counts remained subdued, medium-to-large whale addresses holding between 1,000 and 10,000 Ethereum actively accumulated tokens during the price dip. At the same time, the staking ecosystem continued to mature, with a significant portion of the total supply locked in staking contracts. This reduction in liquid exchange supply, combined with anticipated network scalability upgrades slated for later in the year, provided a structural floor for the asset. Consequently, the market is currently defined by a tug-of-war between short-term regulatory adjustments and institutional outflows versus long-chain accumulation and supply-side deflationary dynamics.
Technical Analysis of Ethereum (ETHUSD)
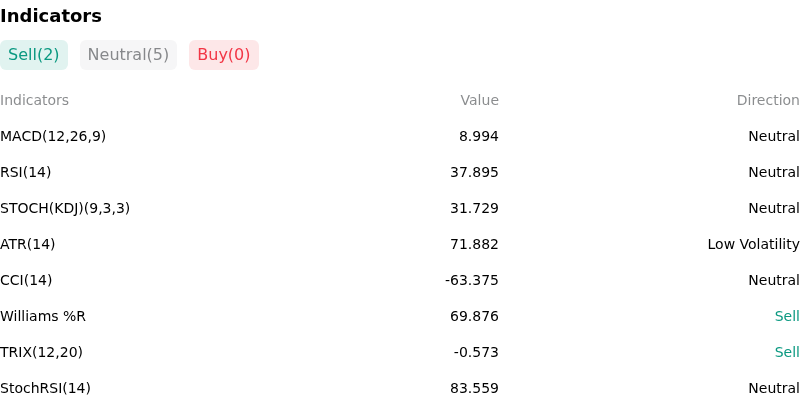
Technically, Ethereum (ETHUSD) shows a MACD (12,26,9) value of 8.994, indicating a neutral signal. The RSI at 37.895 suggests neutral condition and the Williams %R at 69.876 suggests sell condition. Please monitor closely.
More details about Ethereum (ETHUSD)
Recent Events and Risks:
- Prolonged Spot ETF Outflows: U.S. spot Ethereum ETFs are experiencing persistent redemptions, highlighted by a $27.6 million net outflow on June 30, 2026, and a cumulative $345 million in outflows since June 17. Total holdings among the nine approved spot ETFs have plummeted from 6.14 million ETH to 5.19 million ETH in 2026, signaling a significant decay in institutional conviction.
- Severe On-Chain Activity Decay: Active Ethereum network addresses have collapsed by roughly 46% from their early 2026 peak of 795,000 down to a 14-day average of approximately 420,000. This drastic falloff in gas-burning transactions and user utility highlights a weakening on-chain demand profile, exposing the asset to further price pressure.
- Macro and Tech Correlation Drag: Ethereum’s strong correlation to tech stocks (historically around 0.78 with the Nasdaq 100) has dragged ETHUSD down to near-yearly lows of approximately $1,570 amid broad risk-off sentiment. Unlike Bitcoin, which benefits from defensive inflows, Ethereum lacks a resilient treasury floor, leaving it highly vulnerable to speculative sell-offs driven by global macro headwinds.
- Bearish Technical Breaks and Death Cross: Ethereum has closed three consecutive quarters in the red for the first time in its history. The daily and weekly charts have confirmed a highly bearish technical posture, including a classic "death cross" (50-day EMA crossing below the 200-day EMA), raising institutional fears of a further 30% to 60% breakdown toward the $1,150 or $750 demand zones if the critical $1,500 support level fails.
This article may include AI-generated content that is human-reviewed, which is for reference and general information purposes only and does not constitute investment advice.
Recommended Articles


Comments (0)
Click the $ button, enter the symbol, and select to link a stock, ETF, or other ticker.